Technology
Chart: The AI-mazing Patent Race
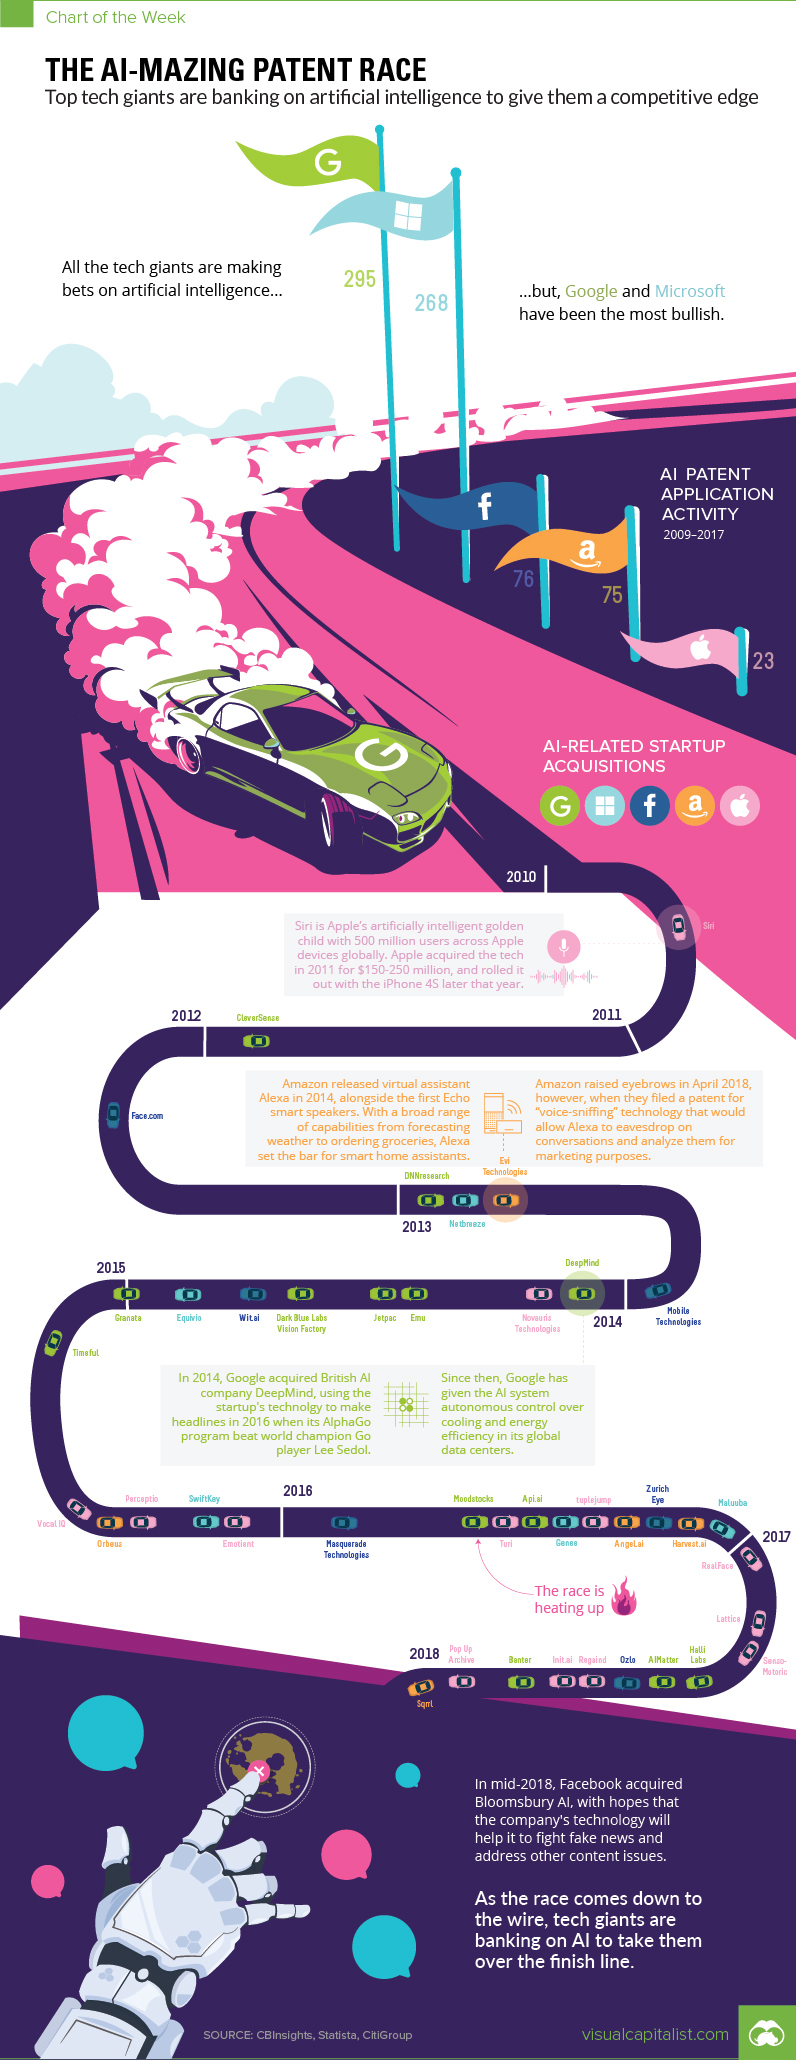
Chart: The AI-mazing Patent Race
The Chart of the Week is a weekly Visual Capitalist feature on Fridays.
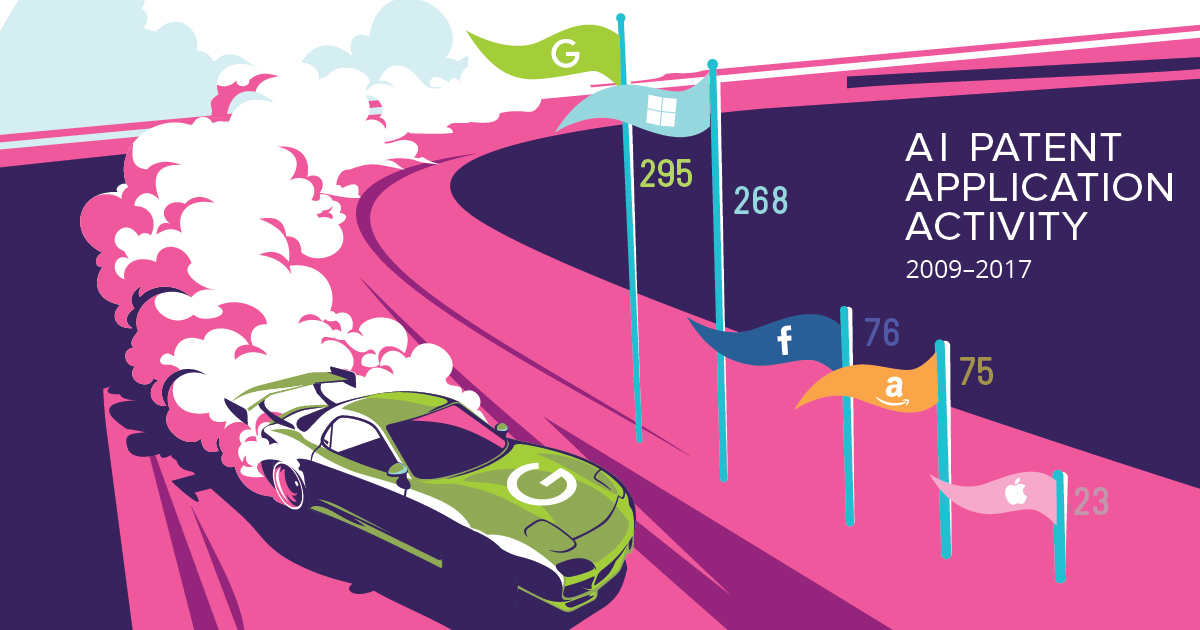
Artificial Intelligence is transforming the way we live, and the tech giants are racing to stay ahead of the curve.
AI-related funding totaled an estimated $15.2 billion in 2017, a 144% increase over the previous year. The U.S. tech industry leads with a 50% share of those investments, even with China swiftly closing the gap in terms of patents and AI research.
AI itself isn’t new, but boosted computing power, increased connectivity, and the sheer volume of data has paved the way for the fourth industrial revolution of AI.
“The coming era will be looked back upon as the ‘AI era,’ when AI became the defining competitive advantage for corporations, government agencies, and investment professionals,” predicts David Nadler, founder of Kensho Technologies.
The Potential of AI
Artificial Intelligence is less about sentience and more about accelerated learning.
AI technology looks for patterns, learns from experience, and predicts responses based on historical data. An AI-powered computer can’t produce a unique thought, but it can probably predict yours. The end result: AI is able to learn new things at such a speed that it can predict your behavior and preempt your requests.
From the advancements in natural language processing that make Siri and Alexa possible, to the machine learning advancements that give robo-advisors their trading chops, AI’s ability to simulate human thinking means it can also streamline our lives. It can preempt our needs and requests, making products and services more user friendly as machines learn our needs and figure out how to serve us better.
This makes AI a vital source of competitive advantage.
AI’s Competitive Advantage
In their quest to stay on top of the Silicon Valley food chain, familiar tech and retail giants are dipping their toes in AI to execute diverse strategies:
Amazon
Amazon leverages AI technology to analyze and predict your shopping patterns. Alexa is very Artificially Intelligent indeed, and the revolutionary Amazon Go model continues to push the boundaries of AI tech on the ground.
Google
Google uses machine learning and pattern recognition in its search and facial recognition services, as well as natural language processing for real-time language translation. The company has also released a series of smart home products, like the Nest thermostat. After acquiring more than 50 AI startups in 2015-16, this seems like only the beginning for Google’s AI upgrade.
Microsoft
Microsoft’s Cortana is powered by machine learning, allowing the virtual assistant to build insight and expertise over time. In 2016, the tech giant added Research and AI as their fourth silo alongside Office, Windows, and Cloud, with the stated goal of making broad-spectrum AI application more accessible and everyday machines more intelligent.
Apple
Apple is notoriously tight-lipped about their AI research, but it’s safe to say Siri is only the tip of the iceberg. The tech giant received a patent this year for augmented-reality glasses, slated for a release in 2020.
Facebook
Facebook uses artificial intelligence to suggest photo tags, populate your newsfeed, and detect bots and fake users. The social media giant has also come under fire for their widespread use of AI analytics to target users for marketing and messaging purposes.
These tech kings are driving the research that will increasingly intertwine our lives with artificial intelligence, and it’s that investment that just might secure their future.


Technology
All of the Grants Given by the U.S. CHIPS Act
Intel, TSMC, and more have received billions in subsidies from the U.S. CHIPS Act in 2024.


All of the Grants Given by the U.S. CHIPS Act
This was originally posted on our Voronoi app. Download the app for free on iOS or Android and discover incredible data-driven charts from a variety of trusted sources.
This visualization shows which companies are receiving grants from the U.S. CHIPS Act, as of April 25, 2024. The CHIPS Act is a federal statute signed into law by President Joe Biden that authorizes $280 billion in new funding to boost domestic research and manufacturing of semiconductors.
The grant amounts visualized in this graphic are intended to accelerate the production of semiconductor fabrication plants (fabs) across the United States.
Data and Company Highlights
The figures we used to create this graphic were collected from a variety of public news sources. The Semiconductor Industry Association (SIA) also maintains a tracker for CHIPS Act recipients, though at the time of writing it does not have the latest details for Micron.
| Company | Federal Grant Amount | Anticipated Investment From Company |
|---|---|---|
| 🇺🇸 Intel | $8,500,000,000 | $100,000,000,000 |
| 🇹🇼 TSMC | $6,600,000,000 | $65,000,000,000 |
| 🇰🇷 Samsung | $6,400,000,000 | $45,000,000,000 |
| 🇺🇸 Micron | $6,100,000,000 | $50,000,000,000 |
| 🇺🇸 GlobalFoundries | $1,500,000,000 | $12,000,000,000 |
| 🇺🇸 Microchip | $162,000,000 | N/A |
| 🇬🇧 BAE Systems | $35,000,000 | N/A |
BAE Systems was not included in the graphic due to size limitations
Intel’s Massive Plans
Intel is receiving the largest share of the pie, with $8.5 billion in grants (plus an additional $11 billion in government loans). This grant accounts for 22% of the CHIPS Act’s total subsidies for chip production.
From Intel’s side, the company is expected to invest $100 billion to construct new fabs in Arizona and Ohio, while modernizing and/or expanding existing fabs in Oregon and New Mexico. Intel could also claim another $25 billion in credits through the U.S. Treasury Department’s Investment Tax Credit.
TSMC Expands its U.S. Presence
TSMC, the world’s largest semiconductor foundry company, is receiving a hefty $6.6 billion to construct a new chip plant with three fabs in Arizona. The Taiwanese chipmaker is expected to invest $65 billion into the project.
The plant’s first fab will be up and running in the first half of 2025, leveraging 4 nm (nanometer) technology. According to TrendForce, the other fabs will produce chips on more advanced 3 nm and 2 nm processes.
The Latest Grant Goes to Micron
Micron, the only U.S.-based manufacturer of memory chips, is set to receive $6.1 billion in grants to support its plans of investing $50 billion through 2030. This investment will be used to construct new fabs in Idaho and New York.

-

 Sports1 week ago
The Highest Earning Athletes in Seven Professional Sports
-

 Countries2 weeks ago
Population Projections: The World’s 6 Largest Countries in 2075
-

 Markets2 weeks ago
The Top 10 States by Real GDP Growth in 2023
-

 Demographics2 weeks ago
The Smallest Gender Wage Gaps in OECD Countries
-

 United States2 weeks ago
Where U.S. Inflation Hit the Hardest in March 2024
-

 Green2 weeks ago
Top Countries By Forest Growth Since 2001
-

 United States2 weeks ago
Ranked: The Largest U.S. Corporations by Number of Employees
-

 Maps2 weeks ago
The Largest Earthquakes in the New York Area (1970-2024)