Technology
Visualizing the Massive $15.7 Trillion Impact of AI
For the people most immersed in the tech sector, it’s hard to think of a more controversial topic than the ultimate impact of artificial intelligence (AI) on society.
By eventually empowering machines with a level of superintelligence, there are many different possible outcomes ranging from Kurzweil’s technological singularity to the more dire predictions popularized by Elon Musk.
Despite this wide gap in potential outcomes, most technologists do agree on one thing: AI will have a profound impact on the society and the way we do business.
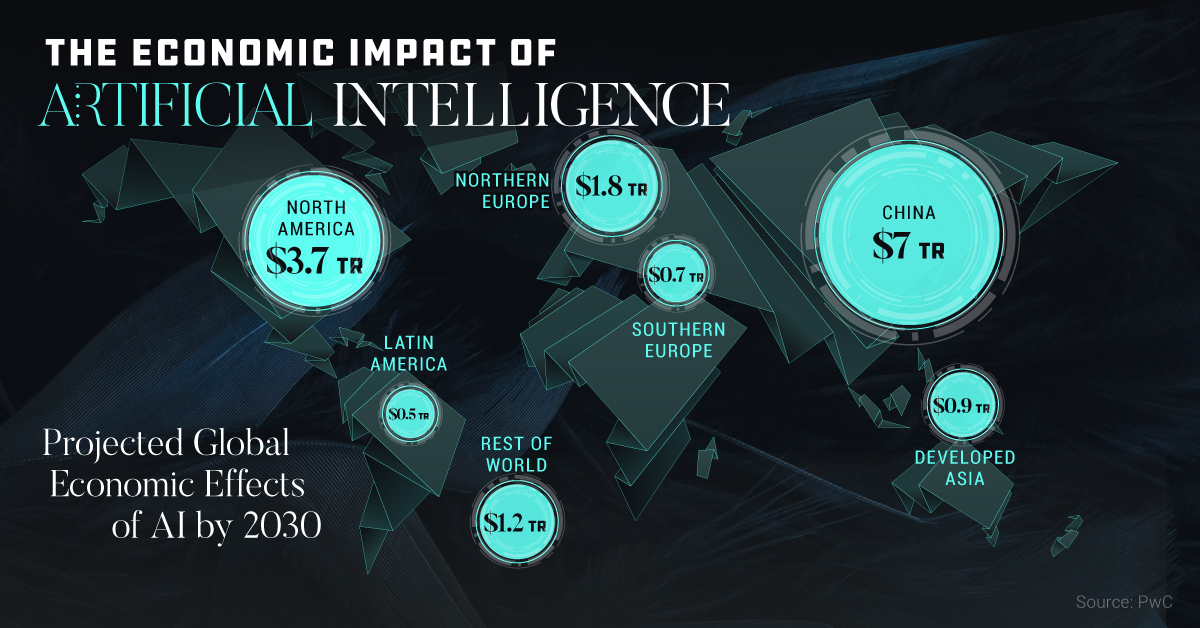
The Economic Impact of AI
Today’s infographic comes from the Extraordinary Future 2017, a new conference in Vancouver, BC that focuses on emerging technologies such as AI, autonomous vehicles, fintech, and blockchain tech.
In the below infographic, we look recent projections from PwC and Accenture regarding AI’s economic impact, as well as the industries and countries that will be the most profoundly affected.

According to PwC’s most recent report on the topic, the impact of artificial intelligence (AI) will be transformative.
By 2030, AI is expected to provide a $15.7 trillion boost to GDP worldwide – the equivalent of adding 13 new Australias to the global economy.
A Geographic Breakdown
Where will AI’s impact be most pronounced?
According to PwC, China will be the region receiving the most economic benefit ($7.0 trillion) from AI being integrated into various industries:
| Region | Economic Impact of AI (2030) | % of Total |
|---|---|---|
| China | $7.0 trillion | 44.6% |
| North America | $3.7 trillion | 23.6% |
| Northern Europe | $1.8 trillion | 11.5% |
| Developed Asia | $0.9 trillion | 5.7% |
| Southern Europe | $0.7 trillion | 4.5% |
| Latin America | $0.5 trillion | 3.2% |
| Rest of World | $1.2 trillion | 7.6% |
| Total | $15.7 trillion | 100.0% |
Further, the global growth from AI can be divided into two major areas, according to PwC: labor productivity improvements ($6.6 trillion) and increased consumer demand ($9.1 trillion).
Industries Most Affected
But how will AI impact industries on an individual level?
For that, we turn to Accenture’s recent report, which breaks down a similar projection of $14 trillion of gross value added (GVA) by 2035, with estimates for AI’s impact on specific industries.
| Industry | 2035 GVA (Baseline) | 2035 GVA (AI steady state) |
|---|---|---|
| Manufacturing | $8.4 trillion | $12.2 trillion |
| Professional Services | $7.5 trillion | $9.3 trillion |
| Wholesale & Retail | $6.2 trillion | $8.4 trillion |
| Public Services | $4.0 trillion | $4.9 trillion |
| Information & Communication | $3.7 trillion | $4.7 trillion |
| Financial Services | $3.4 trillion | $4.6 trillion |
| Construction | $2.8 trillion | $3.3 trillion |
| Transportation & Storage | $2.1 trillion | $2.9 trillion |
Manufacturing will see nearly $4 trillion in growth from AI alone – and many other industries will undergo significant changes as well.
To learn more about other tech that will have a big impact on our future, see a Timeline of Future Technology.


Technology
All of the Grants Given by the U.S. CHIPS Act
Intel, TSMC, and more have received billions in subsidies from the U.S. CHIPS Act in 2024.


All of the Grants Given by the U.S. CHIPS Act
This was originally posted on our Voronoi app. Download the app for free on iOS or Android and discover incredible data-driven charts from a variety of trusted sources.
This visualization shows which companies are receiving grants from the U.S. CHIPS Act, as of April 25, 2024. The CHIPS Act is a federal statute signed into law by President Joe Biden that authorizes $280 billion in new funding to boost domestic research and manufacturing of semiconductors.
The grant amounts visualized in this graphic are intended to accelerate the production of semiconductor fabrication plants (fabs) across the United States.
Data and Company Highlights
The figures we used to create this graphic were collected from a variety of public news sources. The Semiconductor Industry Association (SIA) also maintains a tracker for CHIPS Act recipients, though at the time of writing it does not have the latest details for Micron.
| Company | Federal Grant Amount | Anticipated Investment From Company |
|---|---|---|
| 🇺🇸 Intel | $8,500,000,000 | $100,000,000,000 |
| 🇹🇼 TSMC | $6,600,000,000 | $65,000,000,000 |
| 🇰🇷 Samsung | $6,400,000,000 | $45,000,000,000 |
| 🇺🇸 Micron | $6,100,000,000 | $50,000,000,000 |
| 🇺🇸 GlobalFoundries | $1,500,000,000 | $12,000,000,000 |
| 🇺🇸 Microchip | $162,000,000 | N/A |
| 🇬🇧 BAE Systems | $35,000,000 | N/A |
BAE Systems was not included in the graphic due to size limitations
Intel’s Massive Plans
Intel is receiving the largest share of the pie, with $8.5 billion in grants (plus an additional $11 billion in government loans). This grant accounts for 22% of the CHIPS Act’s total subsidies for chip production.
From Intel’s side, the company is expected to invest $100 billion to construct new fabs in Arizona and Ohio, while modernizing and/or expanding existing fabs in Oregon and New Mexico. Intel could also claim another $25 billion in credits through the U.S. Treasury Department’s Investment Tax Credit.
TSMC Expands its U.S. Presence
TSMC, the world’s largest semiconductor foundry company, is receiving a hefty $6.6 billion to construct a new chip plant with three fabs in Arizona. The Taiwanese chipmaker is expected to invest $65 billion into the project.
The plant’s first fab will be up and running in the first half of 2025, leveraging 4 nm (nanometer) technology. According to TrendForce, the other fabs will produce chips on more advanced 3 nm and 2 nm processes.
The Latest Grant Goes to Micron
Micron, the only U.S.-based manufacturer of memory chips, is set to receive $6.1 billion in grants to support its plans of investing $50 billion through 2030. This investment will be used to construct new fabs in Idaho and New York.

-

 Education1 week ago
How Hard Is It to Get Into an Ivy League School?
-

 Technology2 weeks ago
Ranked: Semiconductor Companies by Industry Revenue Share
-

 Markets2 weeks ago
Ranked: The World’s Top Flight Routes, by Revenue
-

 Demographics2 weeks ago
Population Projections: The World’s 6 Largest Countries in 2075
-

 Markets2 weeks ago
The Top 10 States by Real GDP Growth in 2023
-

 Demographics2 weeks ago
The Smallest Gender Wage Gaps in OECD Countries
-

 Economy2 weeks ago
Where U.S. Inflation Hit the Hardest in March 2024
-

 Green2 weeks ago
Top Countries By Forest Growth Since 2001