Energy
The Base Metal Boom: The Start of a New Bull Market?
Base metals are the most fundamental minerals produced for the modern economy, and metals such as copper, zinc, nickel, lead, and aluminum are the key components that support sustained economic growth.
During periods of economic expansion, these are the first materials to support a bustling economy, reducing inventory at metal warehouses and eventually their source, mines.
A Base Metal Boom?
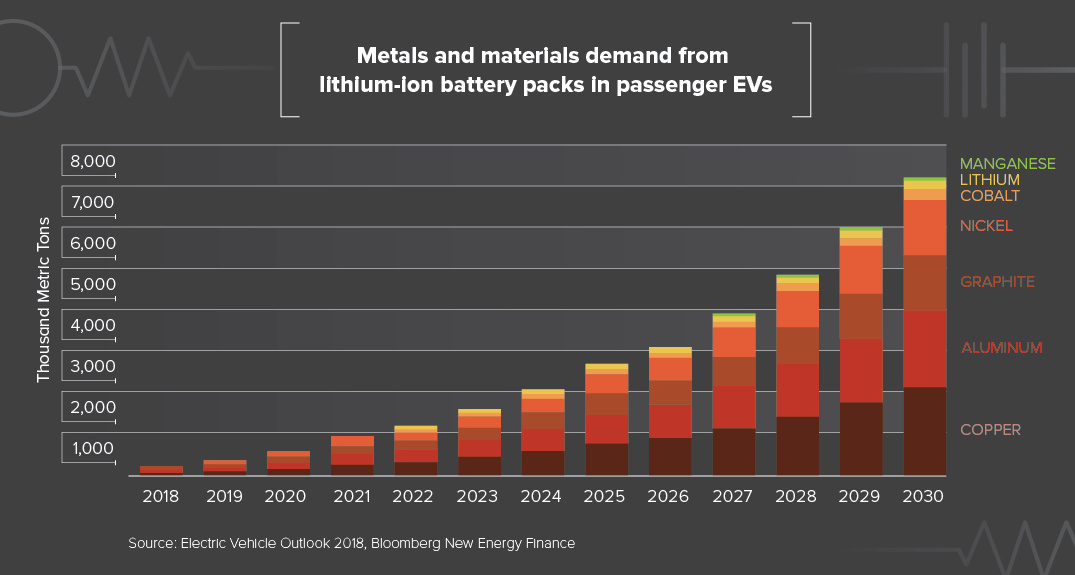
Today’s infographic comes to us from Tartisan Nickel and it takes a look at the surging demand for base metals for use in renewable energy and EVs, and whether this could translate into a sustained bull market for base metals.

Over the last three years, prices of base metals have risen on the back of a growing economy and the anticipation of usage in new technologies such as lithium-ion batteries, green energy, and electric vehicles:
Cobalt: +232%
Zinc: +64%
Nickel: +59%
Copper: +45%
Lead: +34%
Tin: +36%
Aluminum: +42%
As goes the success and development of nations, so goes the production and consumption of base metals.
Why Higher Prices?
Development outside of the Western world has been the main driver of the base metal boom, and it will likely continue to push prices higher in the future.
China has been the primary consumer of metals due to the country’s rapid economic expansion – and with recent efforts to improve environmental standards, the country is simultaneously eliminating supplies of low quality and environmentally toxic metal production. India and Africa will also be emerging sources of base metal demand for the coming decades.
But this is not solely a story of developing nations, as there are some key developments that will include the developed world in the next wave of demand for base metals.
New Sources of Demand
Future demand for base metals will be driven by the onset of a more connected and sustainable world through the adoption of electronic devices and vehicles. This will require a turnover of established infrastructure and the obsolescence of traditional sources of energy, placing pressure on current sources of base metals.
The transformation will be global and will test the limits of current mineral supply.
Renewable Energy Technology
The power grids around the world will adapt to include renewable sources such as wind, solar and other technologies. According to the World Energy Outlook (IEA 2017), it is expected that between 2017 to 2040, a total of 160 GW of global power net additions will come from renewables each year.
Renewables will capture two-thirds of global investment in power plants to 2040 as they become, for many countries, the cheapest source of new power generation. Renewables rely heavily on base metals for their construction, and would not exist without them.
Electric Vehicles
Gasoline cars will be fossils. According to the International Energy Agency, the number of electric vehicles on the road around the world will hit 125 million by 2030. By this time, China will account for 39% of the global EV market.
Dwindling Supply
Currently, warehouse levels in the London Metals Exchange are sitting at five-year lows, with tin leading the pack with a decline of 400%.
According to the Commodity Markets Outlook (World Bank, April 2018), supply could be curtailed by slower ramp-up of new capacity, tighter environmental constraints, sanctions against commodity producers, and rising costs. If new supply does not come into the market, this could also drive prices for base metals higher.
New Supply?
There is only one source to replenish supply and fulfill future demand, and that is with mining.
New mines need to be discovered, developed and come online to meet demand. In the meantime, those that invest in the base metals could see scarcity drive prices up as the economy moves towards its electric future on a more populated planet.
An extended base metal boom may very well be on the horizon.


Energy
Mapped: The Age of Energy Projects in Interconnection Queues, by State
This map shows how many energy projects are in interconnection queues by state and how long these projects have been queued up, on average.


Age of Energy Projects in Interconnection Queues, by State
This was originally posted on our Voronoi app. Download the app for free on iOS or Android and discover incredible data-driven charts from a variety of trusted sources.
By the end of 2023, more than 11,000 energy projects were in interconnection queues in the United States, waiting for a green-light from regional grid operators to proceed with construction.
This map, created in partnership with the National Public Utilities Council, maps out the average age of active energy projects in interconnection queues by state, using data from Berkeley Lab.
Interconnection Queues, Explained
Interconnection queues are lists of energy projects that have made interconnection requests to their regional grid operators. Once submitted, these requests formally initiate the impact study process that each project goes through before grid connection, forming waiting lists for approval known as interconnection queues.
In recent years, both the number and generation capacity of queued projects have surged in the United States, along with the length of time spent in queue.
According to Berkeley Lab, the amount of generation capacity entering queues each year has risen by more than 550% from 2015 to 2023, with average queue duration rising from 3 years to 5 years the same period.
As a result of the growing backlog, a large proportion of projects ultimately withdraw from queues, leading to only 19% of applications reaching commercial operations.
The Backlog: Number of Projects and Average Wait Times
Of the 11,000 active projects in U.S. queues at the end of 2023, Texas, California, and Virginia had the most in queue; 1,208, 947, and 743, respectively.
When looking at the average ages of these projects, all three states hovered around the national average of 34 months (2.83 years), with Texas sporting 28 months, California 33, and Virginia 34.
Vermont, Minnesota, Wisconsin, and Florida, on the other hand, had the highest average queue durations; 54, 49, 47, and 46 months, respectively.
Average Queue Duration by Project Type
At the end of 2023, more than 95% of the generation capacity in active interconnection queues was for emission-free resources. The table below provides a breakdown.
| Project Type | Average Queue Duration (As of 12/31/2023) | Number of Projects in Queue |
|---|---|---|
| Wind | 40 months | 841 |
| Solar | 34 months | 4,506 |
| Wind+Battery | 34 months | 76 |
| Solar+Battery | 27 months | 2,377 |
| Battery | 24 months | 2,818 |
Wind projects had the highest wait times at the end of 2023 with an average age of 40 months (3.33 years). Solar projects, on the other hand, made up more than 40% of projects in queue.
Overall, reducing the time that these renewable energy projects spend in queues can accelerate the transition to a low-carbon energy future.
According to the U.S. Department of Energy, enhancing data transparency, streamlining approval processes, promoting economic efficiency, and maintaining a reliable grid are some of the ways this growing backlog can be mitigated.

-

 Culture6 days ago
The World’s Top Media Franchises by All-Time Revenue
-

 Science2 weeks ago
Visualizing the Average Lifespans of Mammals
-

 Brands2 weeks ago
How Tech Logos Have Evolved Over Time
-

 Energy2 weeks ago
Ranked: The Top 10 EV Battery Manufacturers in 2023
-

 Countries2 weeks ago
Countries With the Largest Happiness Gains Since 2010
-

 Economy2 weeks ago
VC+: Get Our Key Takeaways From the IMF’s World Economic Outlook
-

 Demographics2 weeks ago
The Countries That Have Become Sadder Since 2010
-

 Money1 week ago
Charted: Who Has Savings in This Economy?