Markets
The $80 Trillion World Economy in One Chart
Check out the latest 2023 update of the world economy in one chart.
The $80 Trillion World Economy in One Chart
Check out the latest 2023 update of the world economy in one chart.
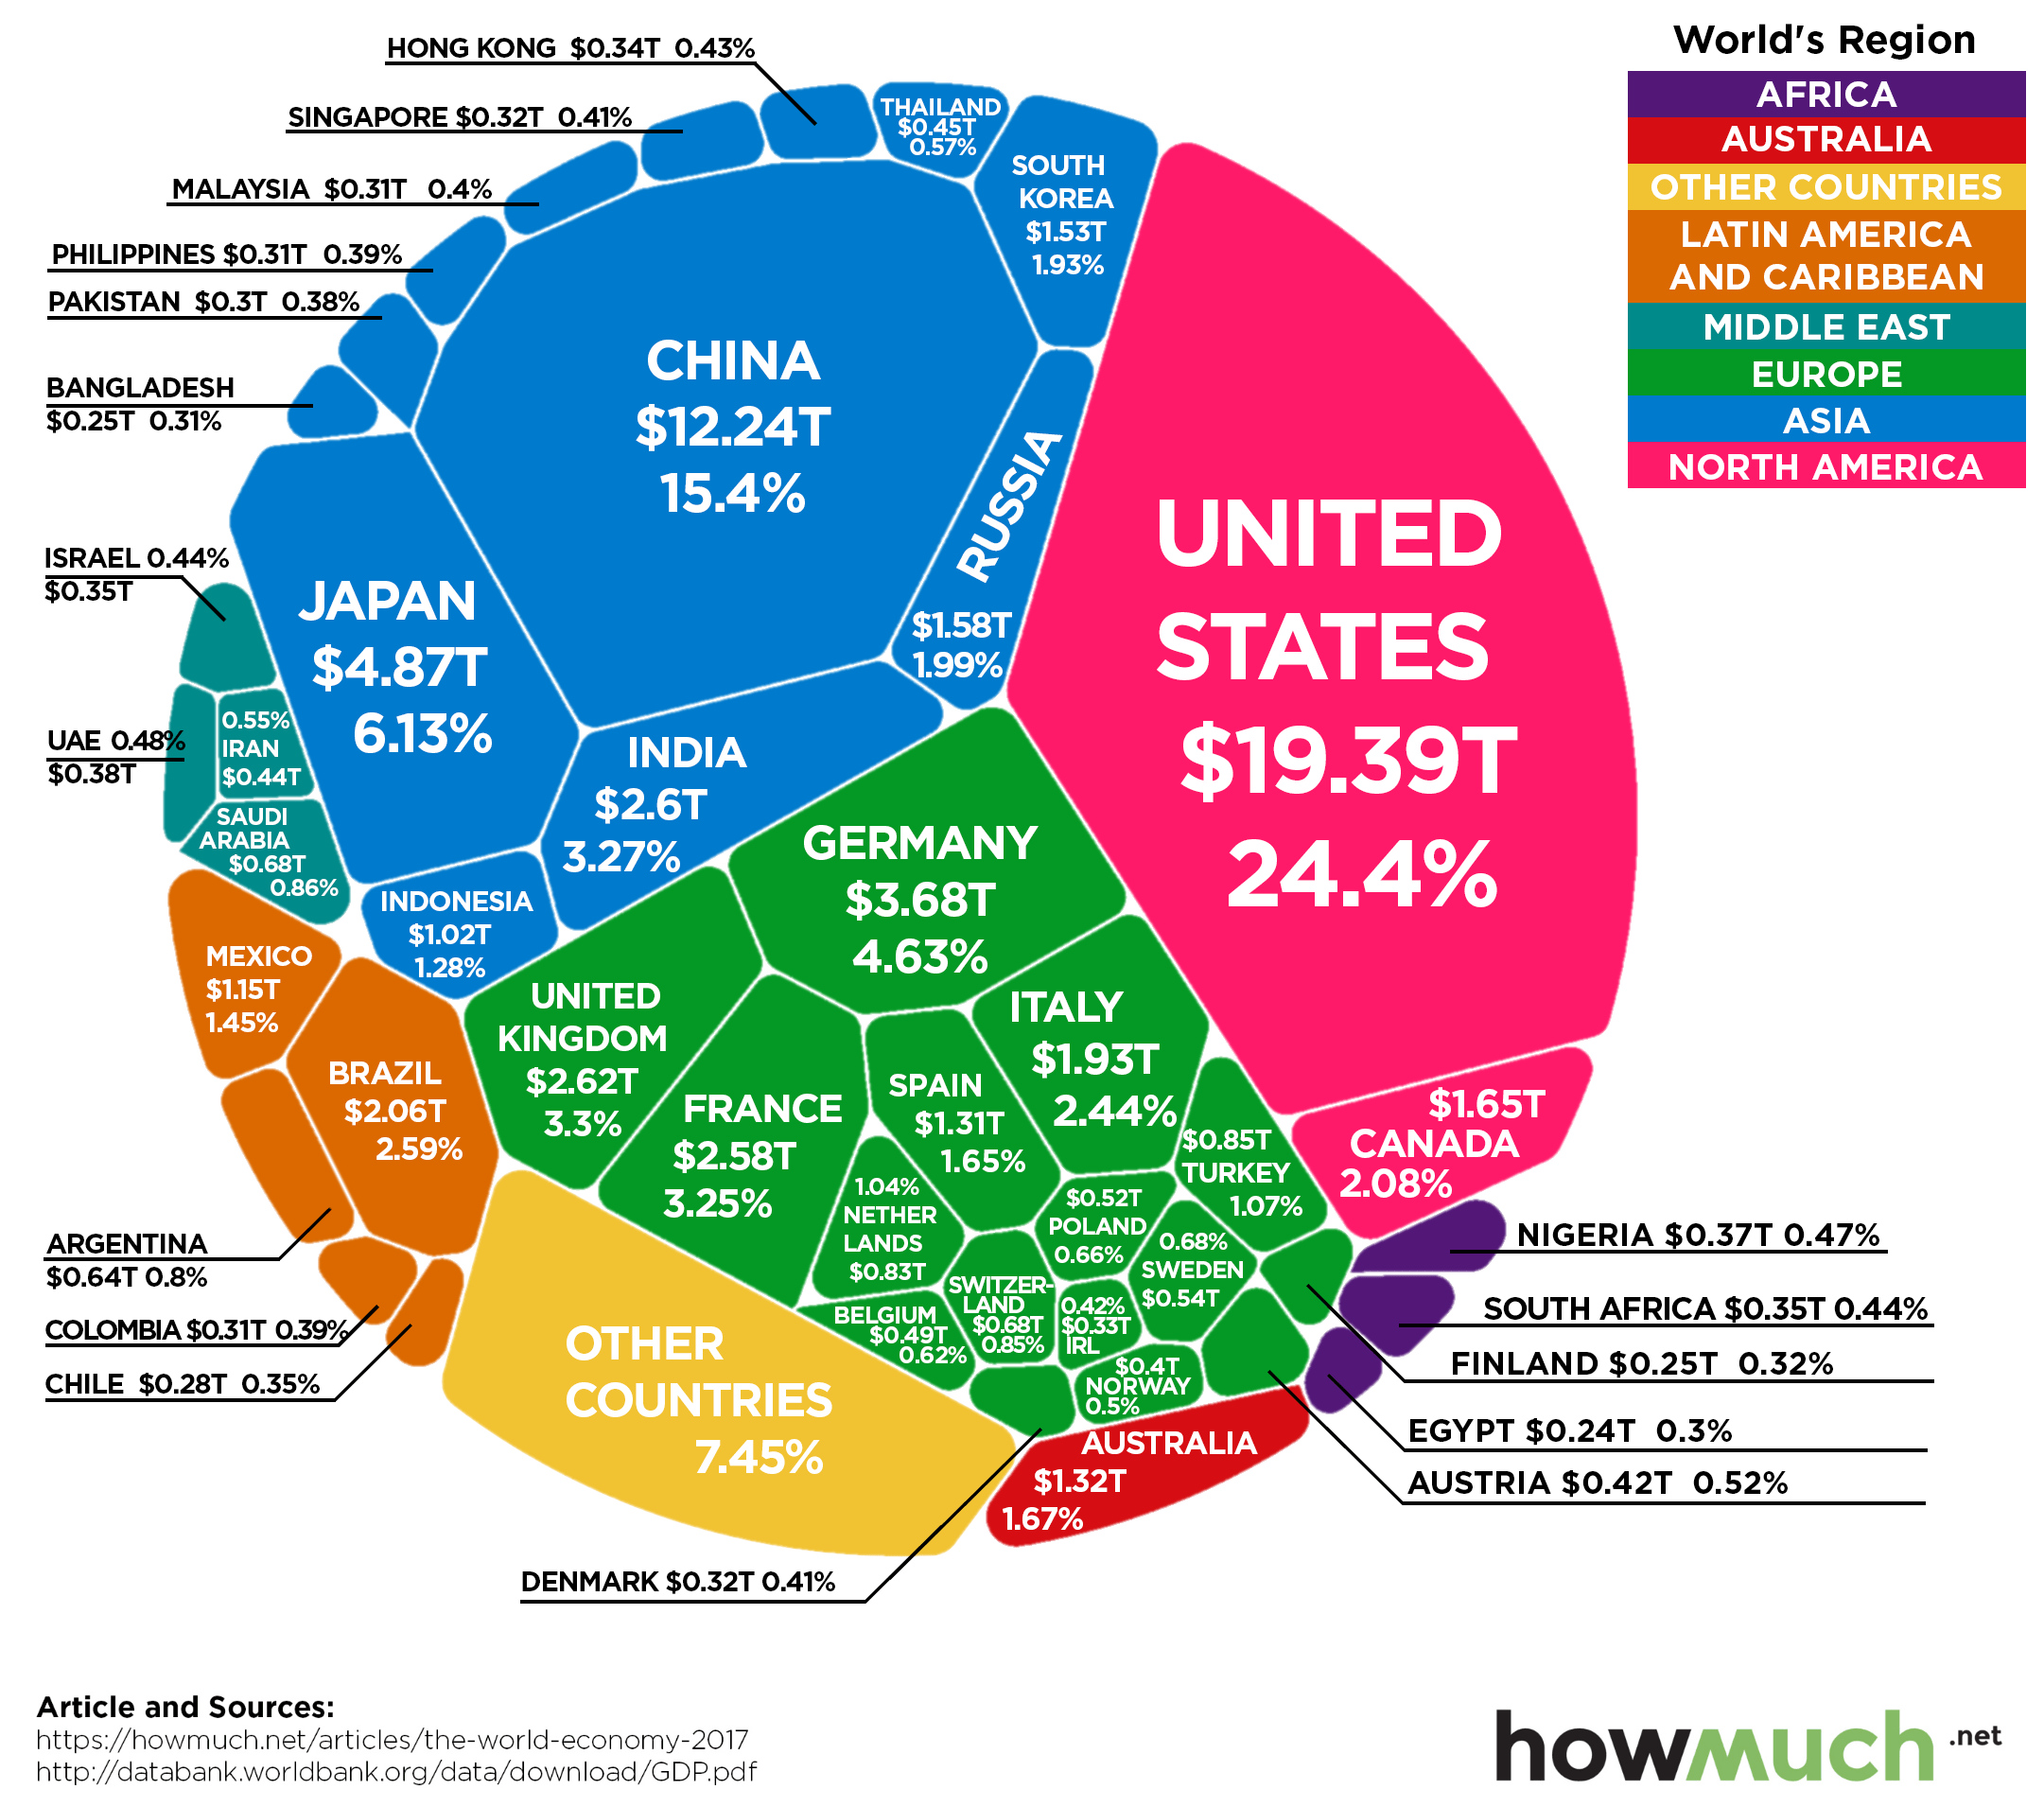
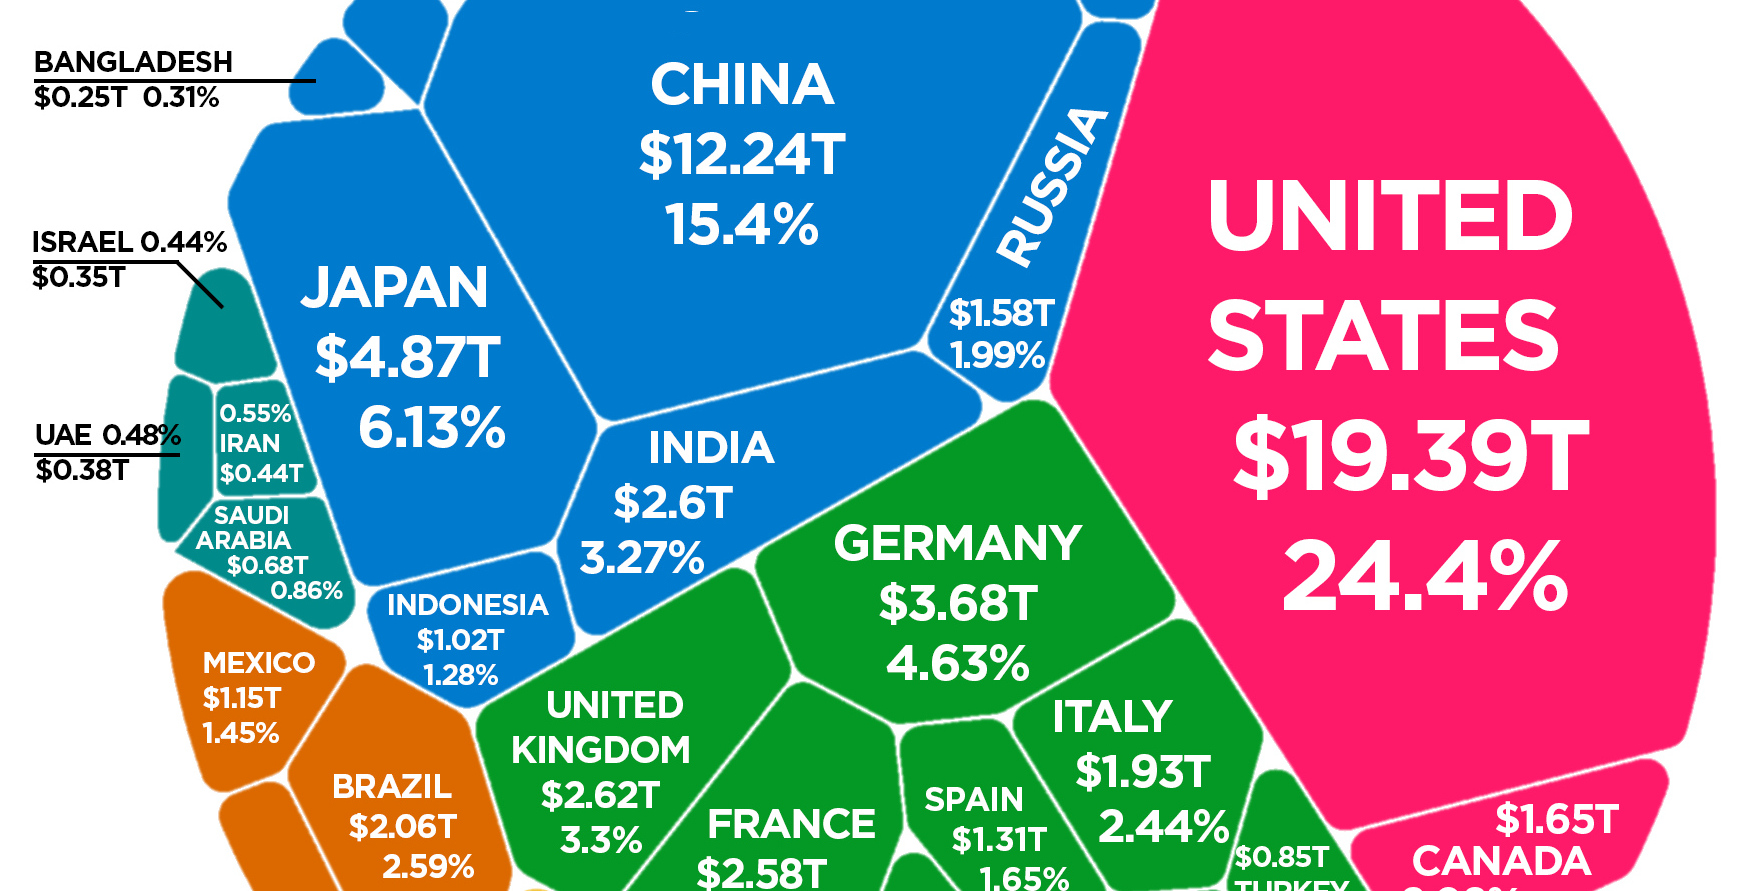
The latest estimate from the World Bank puts global GDP at roughly $80 trillion in nominal terms for 2017.
Today’s chart from HowMuch.net uses this data to show all major economies in a visualization called a Voronoi diagram – let’s dive into the stats to learn more.
The World’s Top 10 Economies
Here are the world’s top 10 economies, which together combine for a whopping two-thirds of global GDP.
| Rank | Country | GDP | % of Global GDP |
|---|---|---|---|
| #1 | United States | $19.4 trillion | 24.4% |
| #2 | China | $12.2 trillion | 15.4% |
| #3 | Japan | $4.87 trillion | 6.1% |
| #4 | Germany | $3.68 trillion | 4.6% |
| #5 | United Kingdom | $2.62 trillion | 3.3% |
| #6 | India | $2.60 trillion | 3.3% |
| #7 | France | $2.58 trillion | 3.3% |
| #8 | Brazil | $2.06 trillion | 2.6% |
| #9 | Italy | $1.93 trillion | 2.4% |
| #10 | Canada | $1.65 trillion | 2.1% |
In nominal terms, the U.S. still has the largest GDP at $19.4 trillion, making up 24.4% of the world economy.
While China’s economy is far behind in nominal terms at $12.2 trillion, you may recall that the Chinese economy has been the world’s largest when adjusted for purchasing power parity (PPP) since 2016.
The next two largest economies are Japan ($4.9 trillion) and Germany ($4.6 trillion) – and when added to the U.S. and China, the top four economies combined account for over 50% of the world economy.
Movers and Shakers
Over recent years, the list of top economies hasn’t changed much – and in a similar visualization we posted 18 months ago, the four aforementioned top economies all fell in the exact same order.
However, look outside of these incumbents, and you’ll see that the major forces shaping the future of the global economy are in full swing, especially when it comes to emerging markets.
Here are some of the most important movements:
India has now passed France in nominal terms with a $2.6 trillion economy, which is about 3.3% of the global total. In the most recent quarter, Indian GDP growth saw its highest growth rate in two years at about 8.2%.
Brazil, despite its very recent economic woes, surpassed Italy in GDP rankings to take the #8 spot overall.
Turkey has surpassed The Netherlands to become the world’s 17th largest economy, and Saudi Arabia has jumped past Switzerland to claim the 19th spot.


Markets
Mapped: Europe’s GDP Per Capita, by Country
Which European economies are richest on a GDP per capita basis? This map shows the results for 44 countries across the continent.


Mapped: Europe’s GDP Per Capita, by Country (2024)
This was originally posted on our Voronoi app. Download the app for free on iOS or Android and discover incredible data-driven charts from a variety of trusted sources.
Europe is home to some of the largest and most sophisticated economies in the world. But how do countries in the region compare with each other on a per capita productivity basis?
In this map, we show Europe’s GDP per capita levels across 44 nations in current U.S. dollars. Data for this visualization and article is sourced from the International Monetary Fund (IMF) via their DataMapper tool, updated April 2024.
Europe’s Richest and Poorest Nations, By GDP Per Capita
Luxembourg, Ireland, and Switzerland, lead the list of Europe’s richest nations by GDP per capita, all above $100,000.
| Rank | Country | GDP Per Capita (2024) |
|---|---|---|
| 1 | 🇱🇺 Luxembourg | $131,380 |
| 2 | 🇮🇪 Ireland | $106,060 |
| 3 | 🇨🇭 Switzerland | $105,670 |
| 4 | 🇳🇴 Norway | $94,660 |
| 5 | 🇮🇸 Iceland | $84,590 |
| 6 | 🇩🇰 Denmark | $68,900 |
| 7 | 🇳🇱 Netherlands | $63,750 |
| 8 | 🇸🇲 San Marino | $59,410 |
| 9 | 🇦🇹 Austria | $59,230 |
| 10 | 🇸🇪 Sweden | $58,530 |
| 11 | 🇧🇪 Belgium | $55,540 |
| 12 | 🇫🇮 Finland | $55,130 |
| 13 | 🇩🇪 Germany | $54,290 |
| 14 | 🇬🇧 UK | $51,070 |
| 15 | 🇫🇷 France | $47,360 |
| 16 | 🇦🇩 Andorra | $44,900 |
| 17 | 🇲🇹 Malta | $41,740 |
| 18 | 🇮🇹 Italy | $39,580 |
| 19 | 🇨🇾 Cyprus | $37,150 |
| 20 | 🇪🇸 Spain | $34,050 |
| 21 | 🇸🇮 Slovenia | $34,030 |
| 22 | 🇪🇪 Estonia | $31,850 |
| 23 | 🇨🇿 Czech Republic | $29,800 |
| 24 | 🇵🇹 Portugal | $28,970 |
| 25 | 🇱🇹 Lithuania | $28,410 |
| 26 | 🇸🇰 Slovakia | $25,930 |
| 27 | 🇱🇻 Latvia | $24,190 |
| 28 | 🇬🇷 Greece | $23,970 |
| 29 | 🇭🇺 Hungary | $23,320 |
| 30 | 🇵🇱 Poland | $23,010 |
| 31 | 🇭🇷 Croatia | $22,970 |
| 32 | 🇷🇴 Romania | $19,530 |
| 33 | 🇧🇬 Bulgaria | $16,940 |
| 34 | 🇷🇺 Russia | $14,390 |
| 35 | 🇹🇷 Türkiye | $12,760 |
| 36 | 🇲🇪 Montenegro | $12,650 |
| 37 | 🇷🇸 Serbia | $12,380 |
| 38 | 🇦🇱 Albania | $8,920 |
| 39 | 🇧🇦 Bosnia & Herzegovina | $8,420 |
| 40 | 🇲🇰 North Macedonia | $7,690 |
| 41 | 🇧🇾 Belarus | $7,560 |
| 42 | 🇲🇩 Moldova | $7,490 |
| 43 | 🇽🇰 Kosovo | $6,390 |
| 44 | 🇺🇦 Ukraine | $5,660 |
| N/A | 🇪🇺 EU Average | $44,200 |
Note: Figures are rounded.
Three Nordic countries (Norway, Iceland, Denmark) also place highly, between $70,000-90,000. Other Nordic peers, Sweden and Finland rank just outside the top 10, between $55,000-60,000.
Meanwhile, Europe’s biggest economies in absolute terms, Germany, UK, and France, rank closer to the middle of the top 20, with GDP per capitas around $50,000.
Finally, at the end of the scale, Eastern Europe as a whole tends to have much lower per capita GDPs. In that group, Ukraine ranks last, at $5,660.
A Closer Look at Ukraine
For a broader comparison, Ukraine’s per capita GDP is similar to Iran ($5,310), El Salvador ($5,540), and Guatemala ($5,680).
According to experts, Ukraine’s economy has historically underperformed to expectations. After the fall of the Berlin Wall, the economy contracted for five straight years. Its transition to a Western, liberalized economic structure was overshadowed by widespread corruption, a limited taxpool, and few revenue sources.
Politically, its transformation from authoritarian regime to civil democracy has proved difficult, especially when it comes to institution building.
Finally, after the 2022 invasion of the country, Ukraine’s GDP contracted by 30% in a single year—the largest loss since independence. Large scale emigration—to the tune of six million refugees—is also playing a role.
Despite these challenges, the country’s economic growth has somewhat stabilized while fighting continues.

-

 Markets6 days ago
Visualized: Interest Rate Forecasts for Advanced Economies
-

 Markets2 weeks ago
Economic Growth Forecasts for G7 and BRICS Countries in 2024
-

 Wealth2 weeks ago
Charted: Which City Has the Most Billionaires in 2024?
-

 Technology2 weeks ago
All of the Grants Given by the U.S. CHIPS Act
-

 Green2 weeks ago
The Carbon Footprint of Major Travel Methods
-

 United States1 week ago
Visualizing the Most Common Pets in the U.S.
-

 Culture1 week ago
The World’s Top Media Franchises by All-Time Revenue
-

 voronoi1 week ago
Best Visualizations of April on the Voronoi App