Technology
5 Ways to Build a $100 Million Company
To build a successful and enduring company, you need more than just hype, publicity, or impressive fundraising skills.
Ultimately it all boils down to one simple principle: you must have a product that solves a pressing problem, and then the right amount of paying customers to make the math work.
Going Hunting
Today’s infographic comes to us from Point Nine Capital, and it highlights five basic revenue models that startups can use to achieve $100 million in annual revenue.
The take home message here is that to build a long-term business, a team must implement a realistic strategy that considers multiple factors including product-market fit, user acquisition, pricing, and revenue per user.
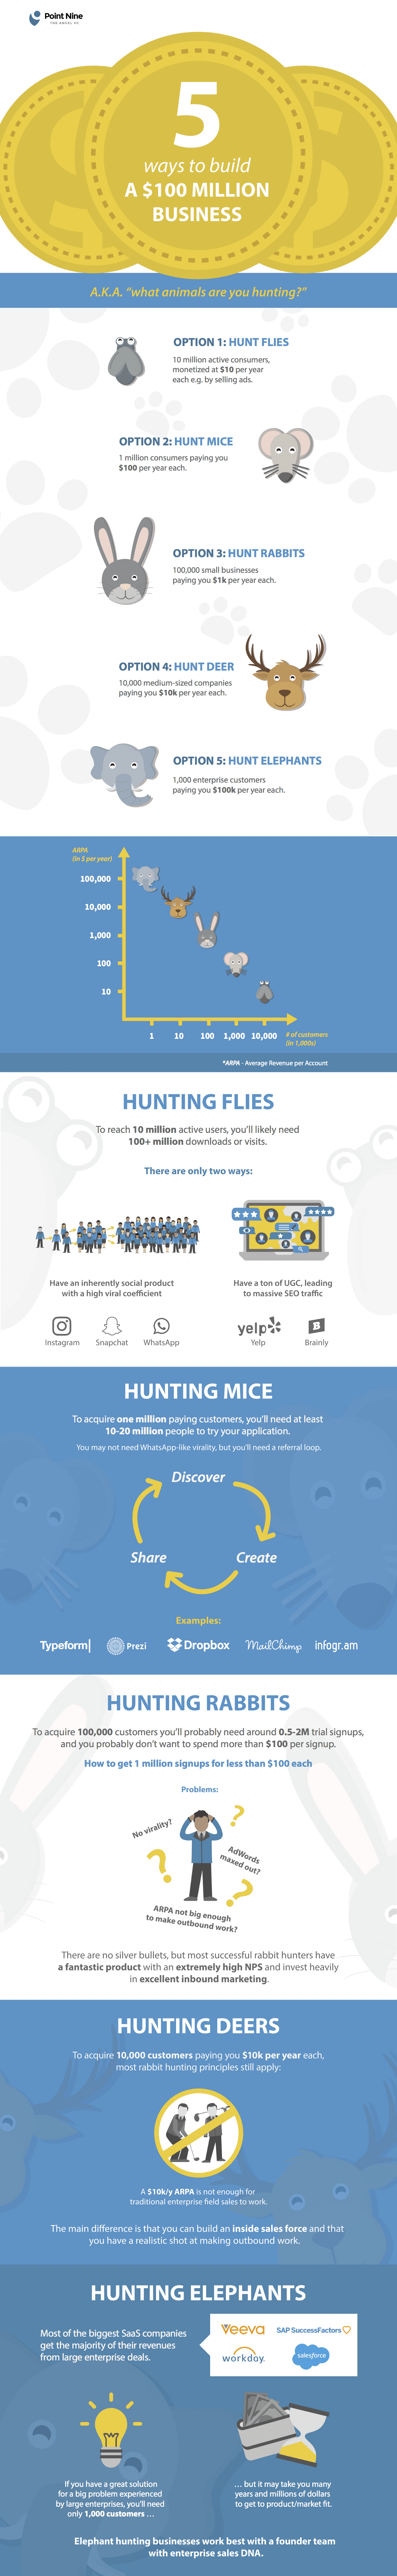
Are you hunting flies, or are you trying to hunt elephants?
Just like in real life, these things require very different strategies and tactics. To build a $100 million revenue per year company, you’ll need to have a clear vision of your product-market fit and the customers you’re going after.
Different Tools
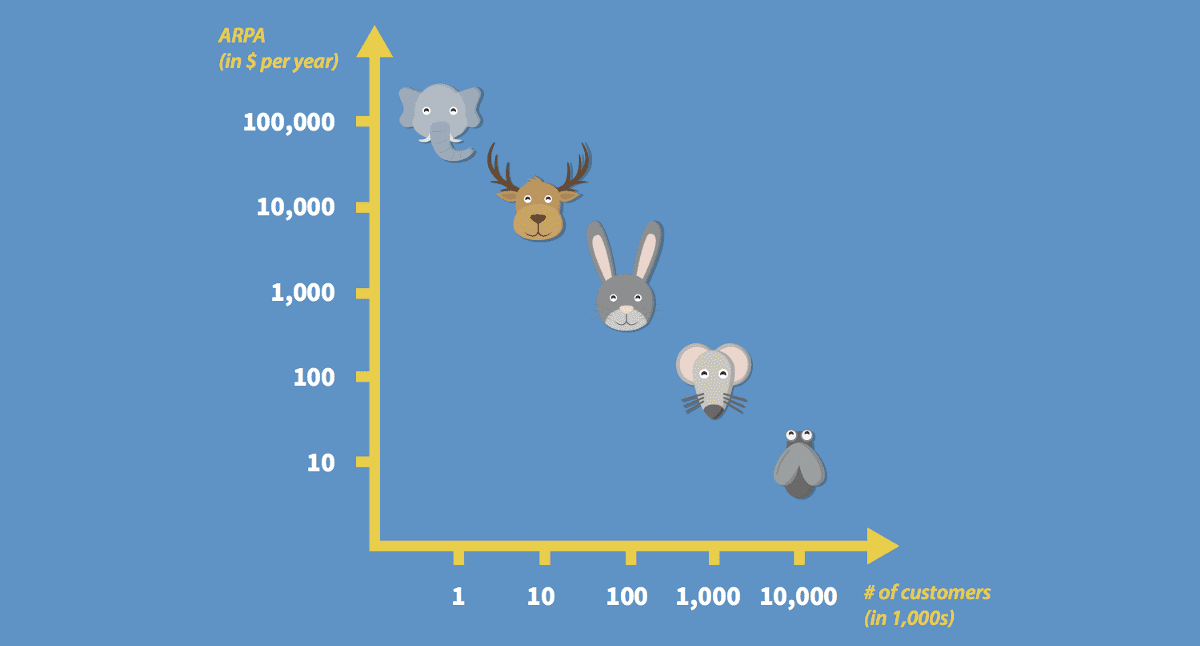
While the hunting analogy may be an oversimplification, it does help illustrate an undeniable truth to building large companies: how many users you will need depends on how much revenue you can earn per user.
This has implications.
If you are going to get $10 in annual ad revenue for each user, then you need a lot of users. If you’re going after Fortune 500 companies, you’ll need far fewer customers, but also a sophisticated and detailed sales strategy.
Flies – $10 per user x 10 million customers = $100 million in annual revenue
It takes a lot of flies to add up.
To build a big business with flies, you’ll need a product with a high viral coefficient (Instagram, WhatsApp, etc.) that spreads your brand quickly and inexpensively. Alternatively, you can build a platform that allows for the creation of massive amounts of user generated content (UGC) such as Yelp or Reddit.
Mice – $100 per user x 1 million customers = $100 million in annual revenue
Mice are still pretty small, but the expectations are higher than for flies. To get $100 per user, these customers will have to be directly paying for something, like a $10 monthly subscription. Music-streaming company Spotify is a good example of a startup hunting for mice.
Rabbits – $1k per user x 100k customers = $100 million in annual revenue
Once you hit rabbit territory, we are basically out of reach of B2C customers. That means to get 100k customers, they will likely have to be small businesses.
To do this, you’ll need a fantastic product, excellent inbound marketing, and an extremely high NPS (Net Promoter Score). The latter metric is used to measure the likelihood a customer would recommend you to their peers.
Deer – $10k per user x 10k customers = $100 million in annual revenue
We’re now getting up there in size – which makes it likely that deer have to be medium-sized businesses. These customers can afford to spend $10,000 per year, but expect a significant return on their investment.
While revenue per user is much higher than preceding levels, it is still not likely enough to warrant traditional enterprise field sales.
Elephants – $100k per user x 1k customers = $100 million in annual revenue
Going after elephants is a totally different world, and requires a skilled sales force, patience, and an enterprise-focused approach. You’ll need to educate Fortune 500 companies on why they should spend $100,000 with you each year – and you’ll need to be able to back that all up with a killer product.
Software as a Service (SaaS) companies like Workday or Salesforce often use this kind of strategy, and it allows them to key in on the features that their most important clients want to see. As we noted in a previous infographic, investors love the predictable revenue stemming from a well-positioned SaaS company.


Technology
Visualizing AI Patents by Country
See which countries have been granted the most AI patents each year, from 2012 to 2022.


Visualizing AI Patents by Country
This was originally posted on our Voronoi app. Download the app for free on iOS or Android and discover incredible data-driven charts from a variety of trusted sources.
This infographic shows the number of AI-related patents granted each year from 2010 to 2022 (latest data available). These figures come from the Center for Security and Emerging Technology (CSET), accessed via Stanford University’s 2024 AI Index Report.
From this data, we can see that China first overtook the U.S. in 2013. Since then, the country has seen enormous growth in the number of AI patents granted each year.
| Year | China | EU and UK | U.S. | RoW | Global Total |
|---|---|---|---|---|---|
| 2010 | 307 | 137 | 984 | 571 | 1,999 |
| 2011 | 516 | 129 | 980 | 581 | 2,206 |
| 2012 | 926 | 112 | 950 | 660 | 2,648 |
| 2013 | 1,035 | 91 | 970 | 627 | 2,723 |
| 2014 | 1,278 | 97 | 1,078 | 667 | 3,120 |
| 2015 | 1,721 | 110 | 1,135 | 539 | 3,505 |
| 2016 | 1,621 | 128 | 1,298 | 714 | 3,761 |
| 2017 | 2,428 | 144 | 1,489 | 1,075 | 5,136 |
| 2018 | 4,741 | 155 | 1,674 | 1,574 | 8,144 |
| 2019 | 9,530 | 322 | 3,211 | 2,720 | 15,783 |
| 2020 | 13,071 | 406 | 5,441 | 4,455 | 23,373 |
| 2021 | 21,907 | 623 | 8,219 | 7,519 | 38,268 |
| 2022 | 35,315 | 1,173 | 12,077 | 13,699 | 62,264 |
In 2022, China was granted more patents than every other country combined.
While this suggests that the country is very active in researching the field of artificial intelligence, it doesn’t necessarily mean that China is the farthest in terms of capability.
Key Facts About AI Patents
According to CSET, AI patents relate to mathematical relationships and algorithms, which are considered abstract ideas under patent law. They can also have different meaning, depending on where they are filed.
In the U.S., AI patenting is concentrated amongst large companies including IBM, Microsoft, and Google. On the other hand, AI patenting in China is more distributed across government organizations, universities, and tech firms (e.g. Tencent).
In terms of focus area, China’s patents are typically related to computer vision, a field of AI that enables computers and systems to interpret visual data and inputs. Meanwhile America’s efforts are more evenly distributed across research fields.
Learn More About AI From Visual Capitalist
If you want to see more data visualizations on artificial intelligence, check out this graphic that shows which job departments will be impacted by AI the most.

-

 Mining1 week ago
Gold vs. S&P 500: Which Has Grown More Over Five Years?
-

 Markets2 weeks ago
Ranked: The Most Valuable Housing Markets in America
-

 Money2 weeks ago
Which States Have the Highest Minimum Wage in America?
-

 AI2 weeks ago
Ranked: Semiconductor Companies by Industry Revenue Share
-

 Markets2 weeks ago
Ranked: The World’s Top Flight Routes, by Revenue
-

 Countries2 weeks ago
Population Projections: The World’s 6 Largest Countries in 2075
-

 Markets2 weeks ago
The Top 10 States by Real GDP Growth in 2023
-

 Demographics2 weeks ago
The Smallest Gender Wage Gaps in OECD Countries