Mining
11 Stunning Visualizations of Gold Show Its Value and Rarity
The Money Project is an ongoing collaboration between Visual Capitalist and Texas Precious Metals that seeks to use intuitive visualizations to explore the origins, nature, and use of money.
Since Ancient times, gold has served a very unique function in society.
Gold is extremely rare, impossible to create out of “thin air”, easily identifiable, malleable, and it does not tarnish. By nature of these properties, gold has been highly valued throughout history for every tiny ounce of weight. That’s why it’s been used by people for centuries as a monetary metal, a symbol of wealth, and a store of value.
Visualizing Gold’s Value and Rarity
With all that value coming from such a small package, sometimes it is hard to put gold’s immense worth into context.
The following 11 images help to capture this about gold, putting things into better perspective.
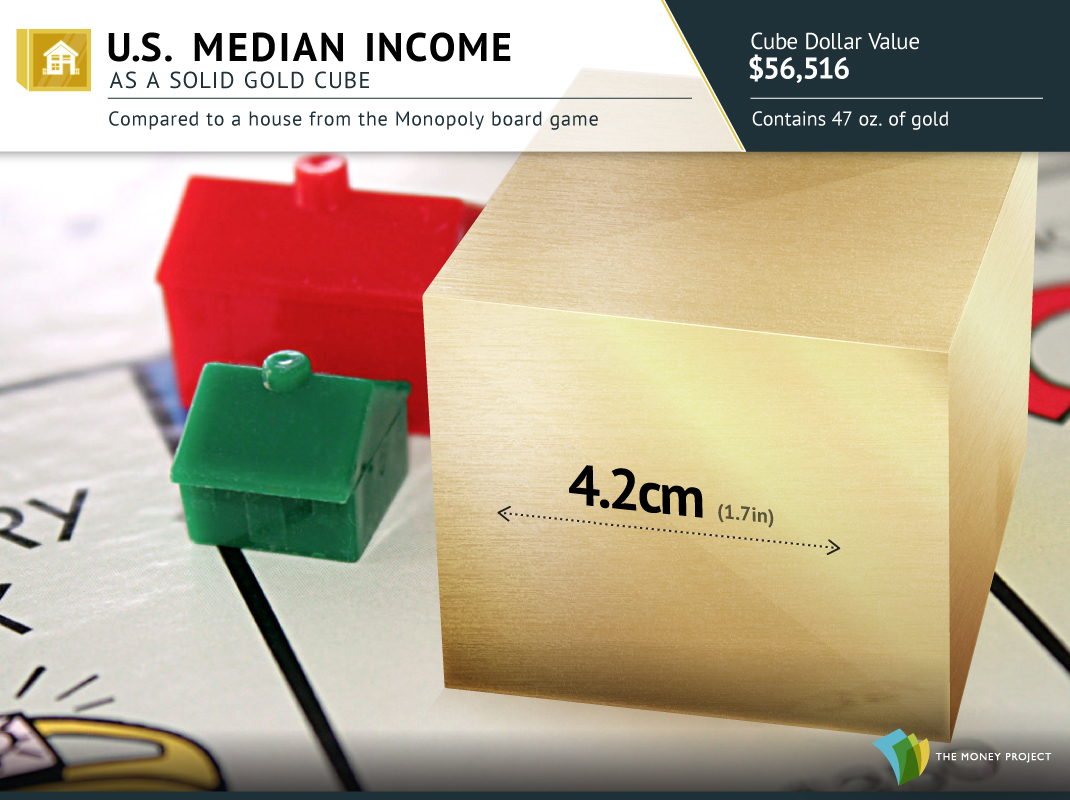
1. The U.S. median income, as a gold cube, easily fits in the palm of your hand.
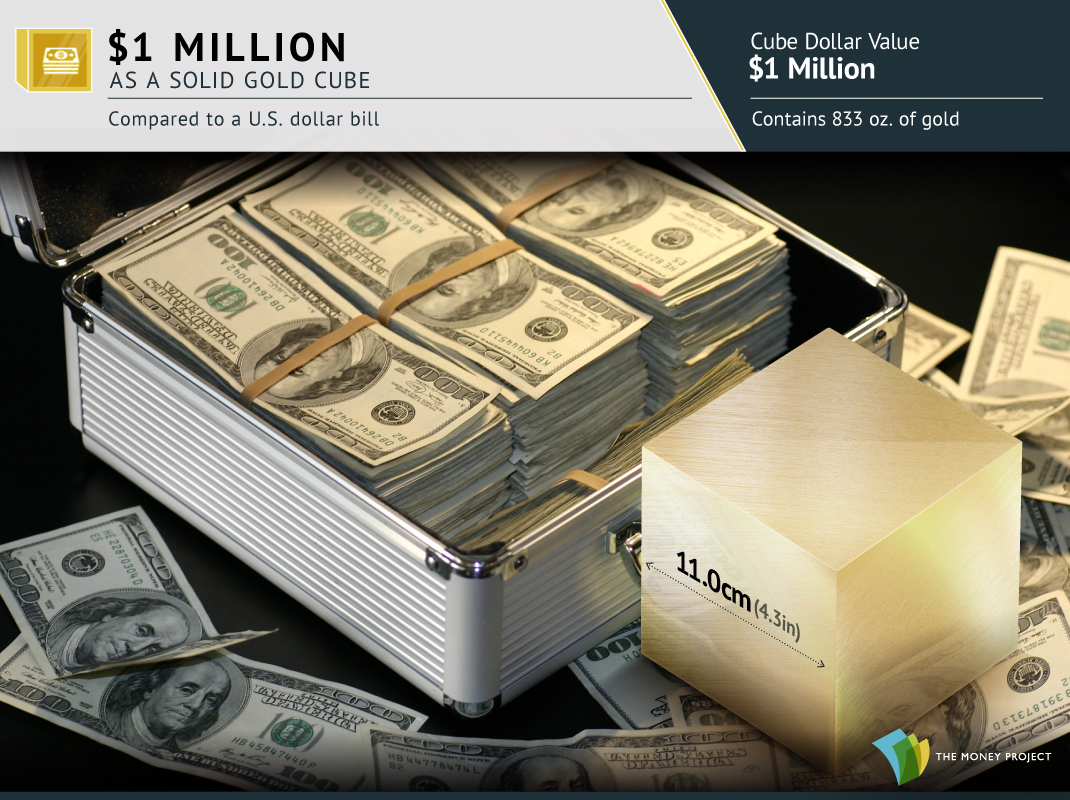
2. A gold cube worth $1 million, has sides that are 2/3 the length of a typical banknote.
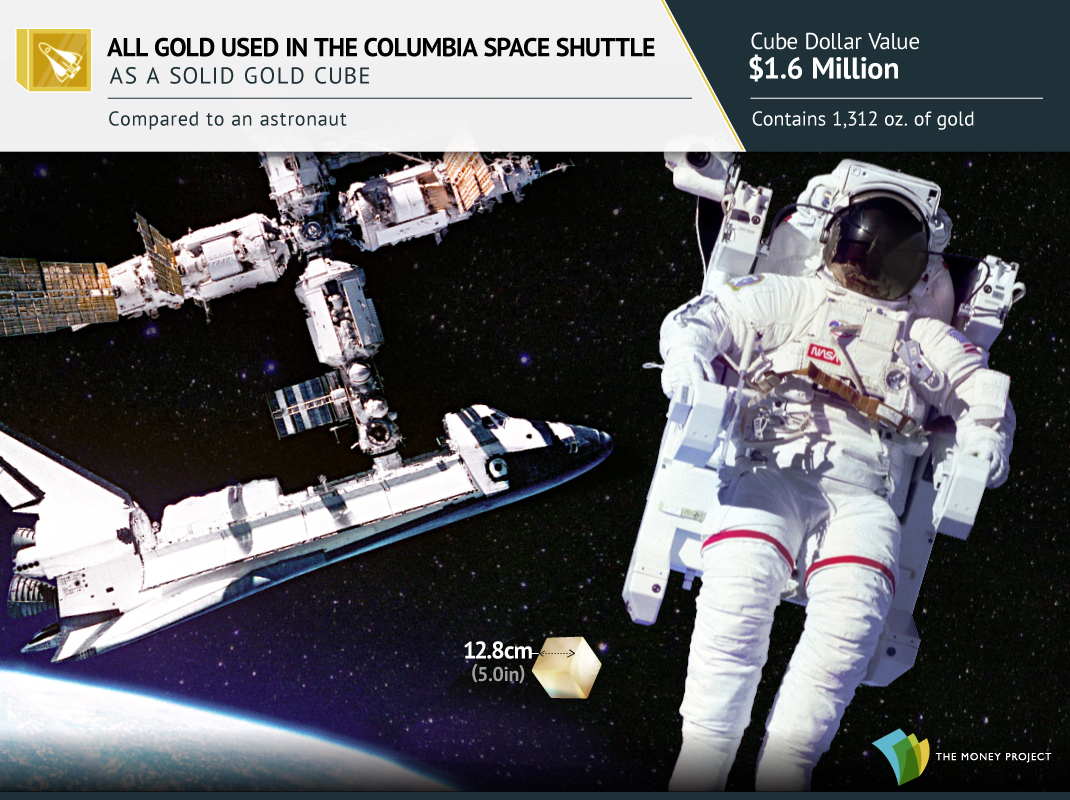
3. All gold used for electrical connections in the Columbia Space Shuttle would be worth $1.6 million today.
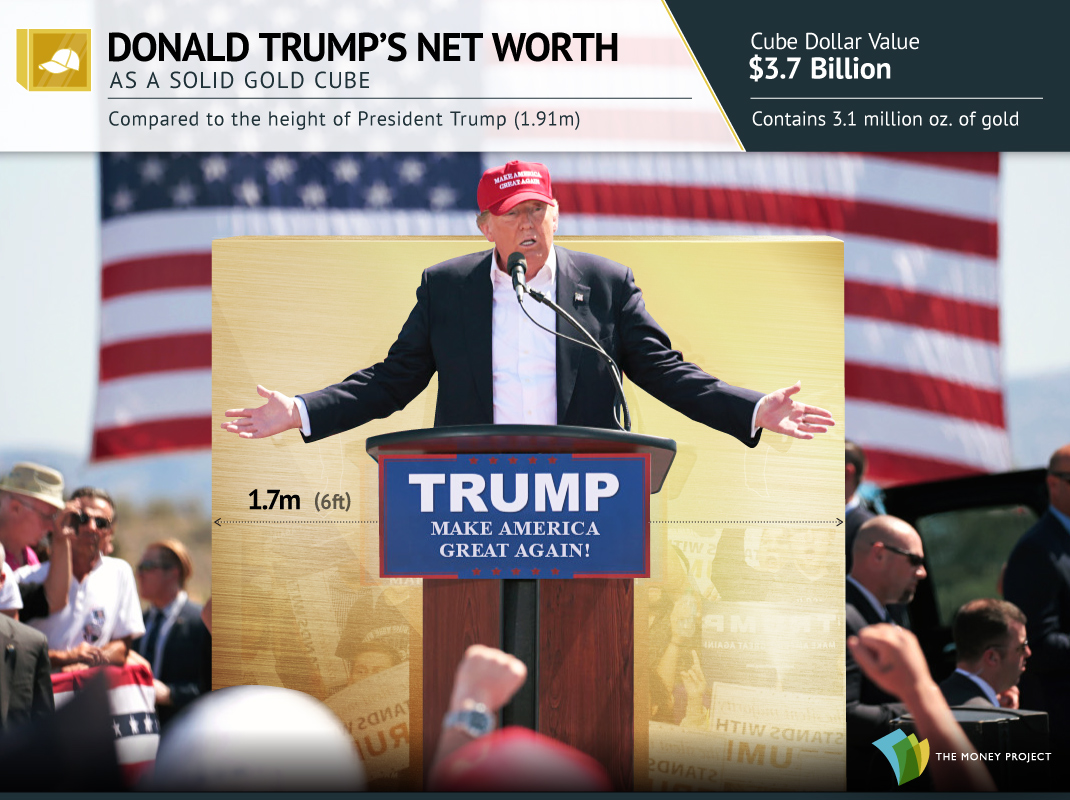
4. Trump’s entire fortune of $3.7 billion as a gold cube would be shorter than Trump himself.
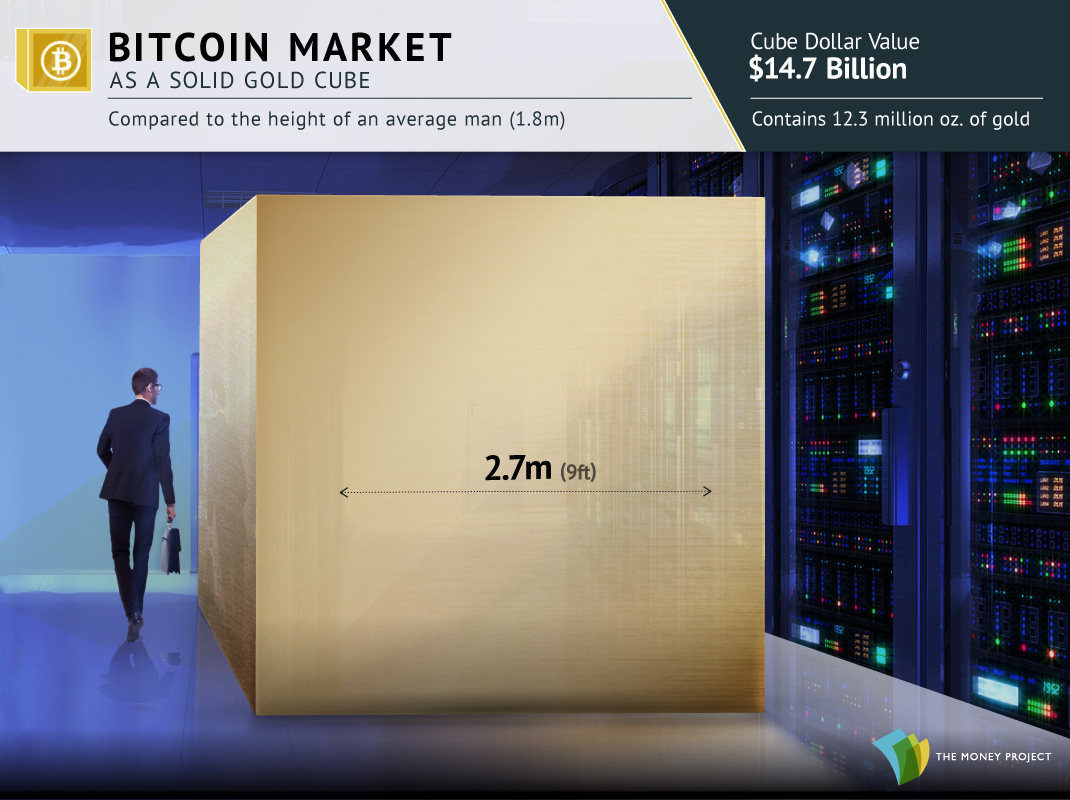
5. As a gold cube, the entire value of the Bitcoin market would fit in a hallway.
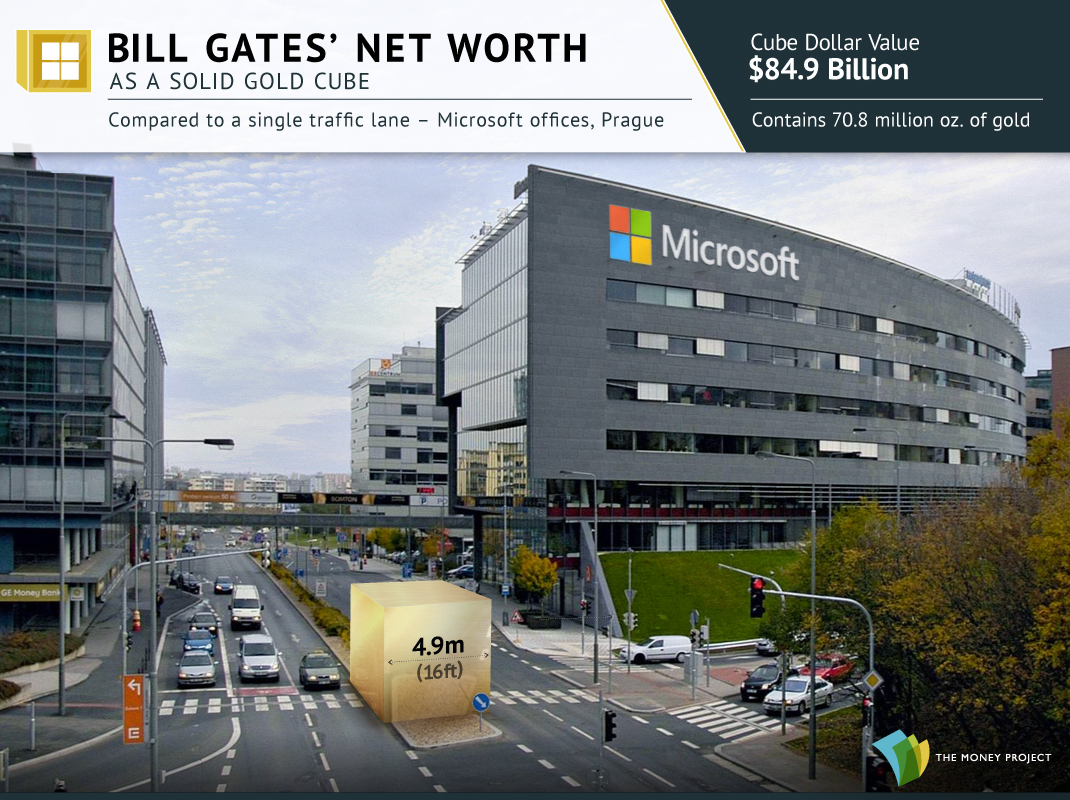
6. The fortune of the richest man on Earth, Bill Gates, would take up a single traffic lane.
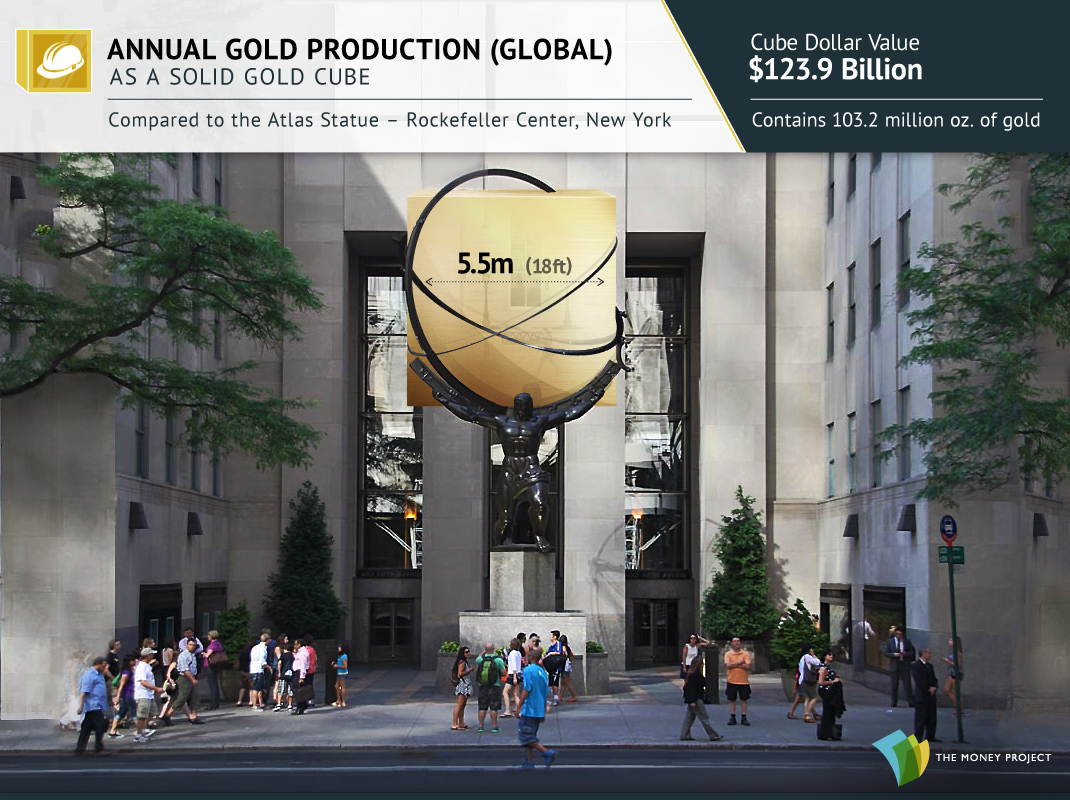
7. The world’s entire annual production of gold is just a 5.5m sided (18 ft) cube.
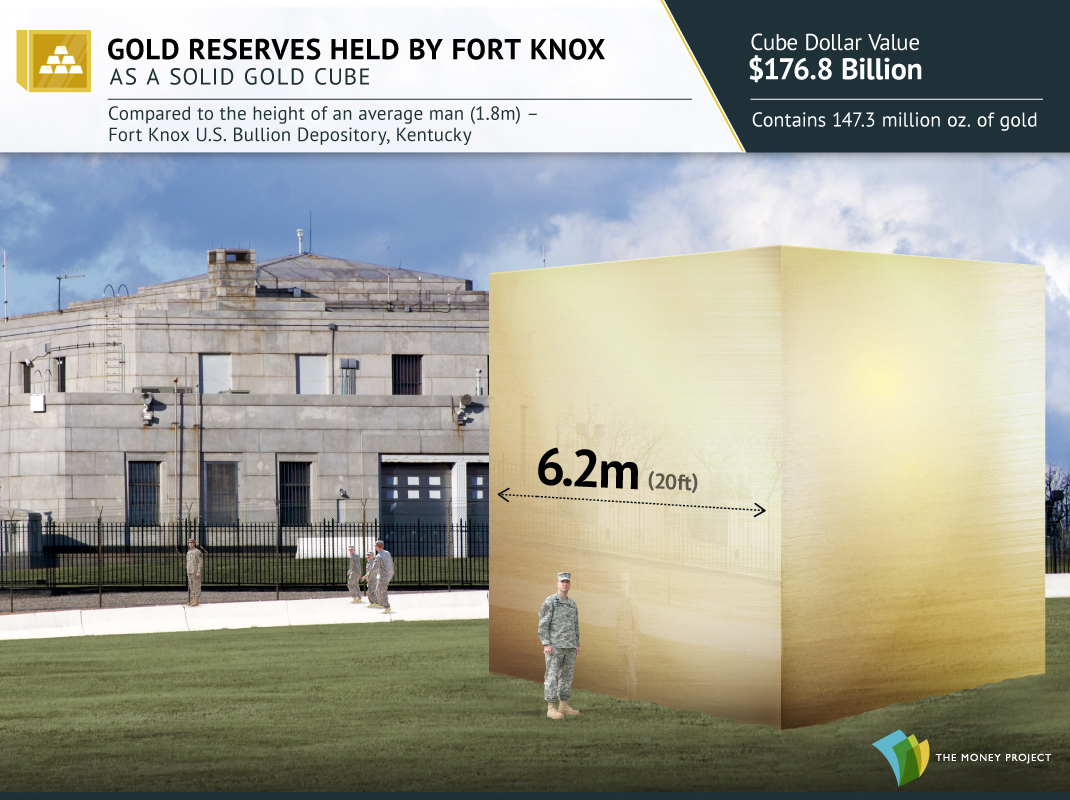
8. Take the 147.3 million oz of gold out of Fort Knox, and it’s only slightly bigger.
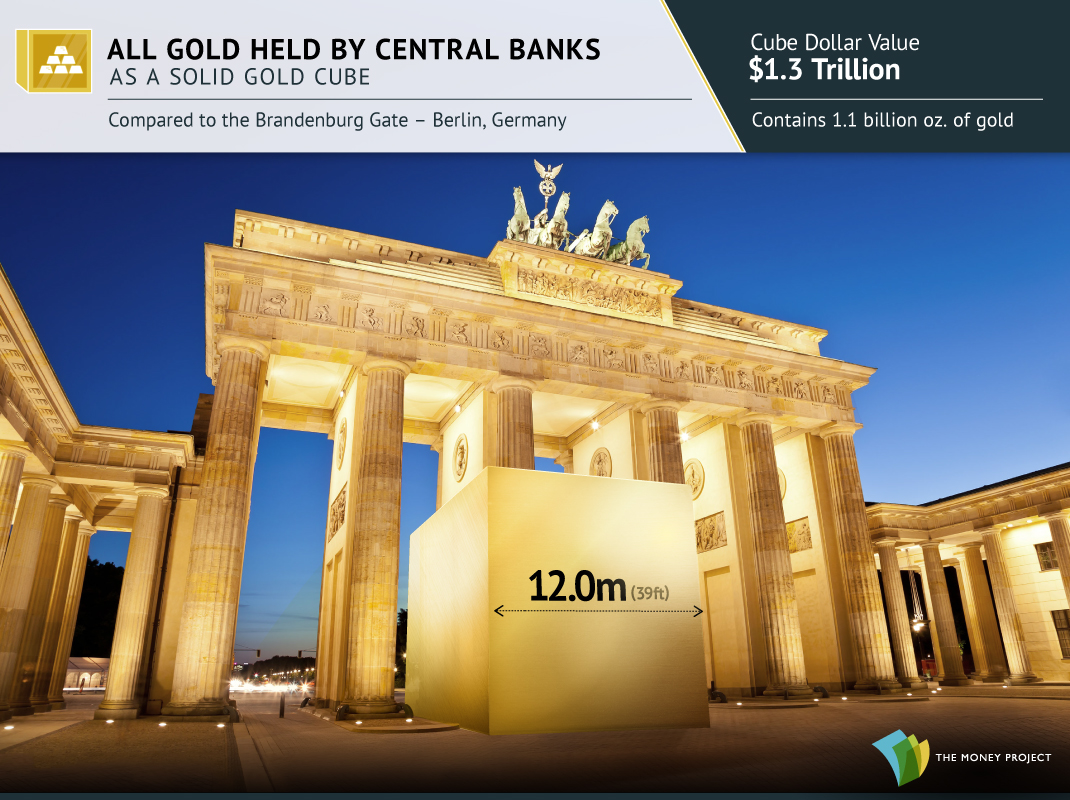
9. All gold held by the Central Banks pales in comparison to the Brandenburg Gate.
10. All gold mined in human history is dwarfed by the Statue of Liberty.

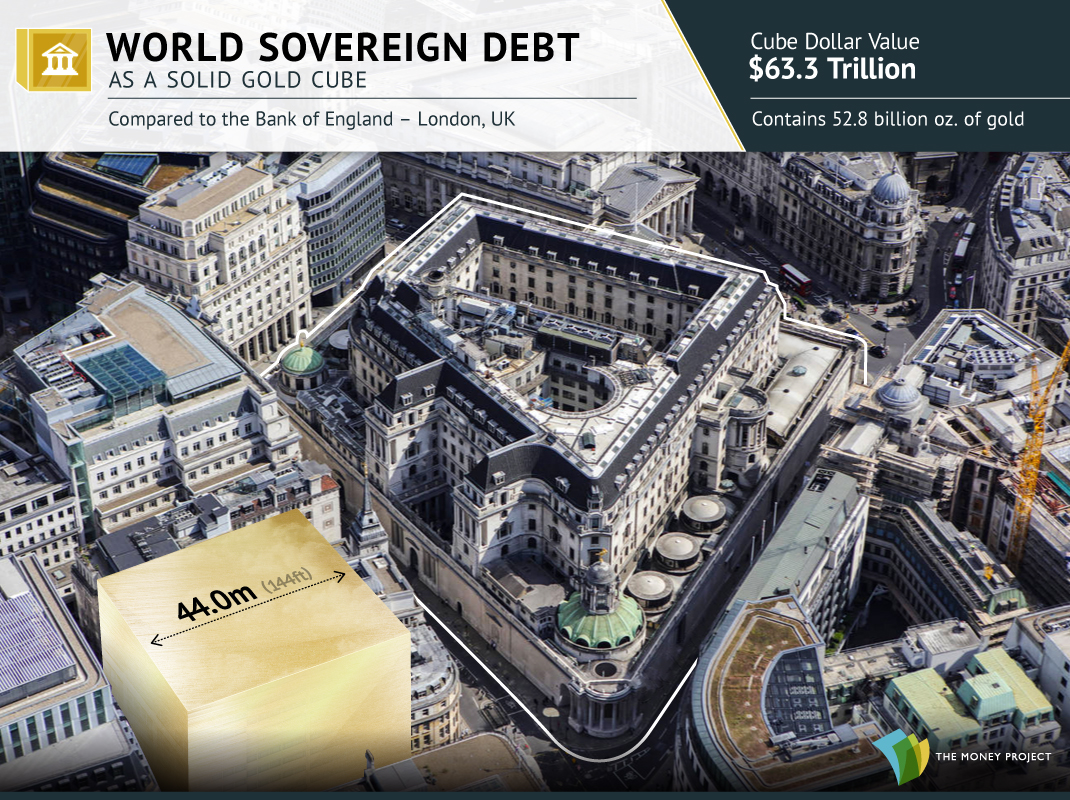
11. To pay off $63 trillion of global sovereign debt, you’d need a gold cube the size of a building.
Liked our visualizations of gold cubes? Check out this motion graphic video that shows how much money has been created by humans.
The Money Project is an ongoing collaboration between Visual Capitalist and Texas Precious Metals that seeks to use intuitive visualizations to explore the origins, nature, and use of money.


Mining
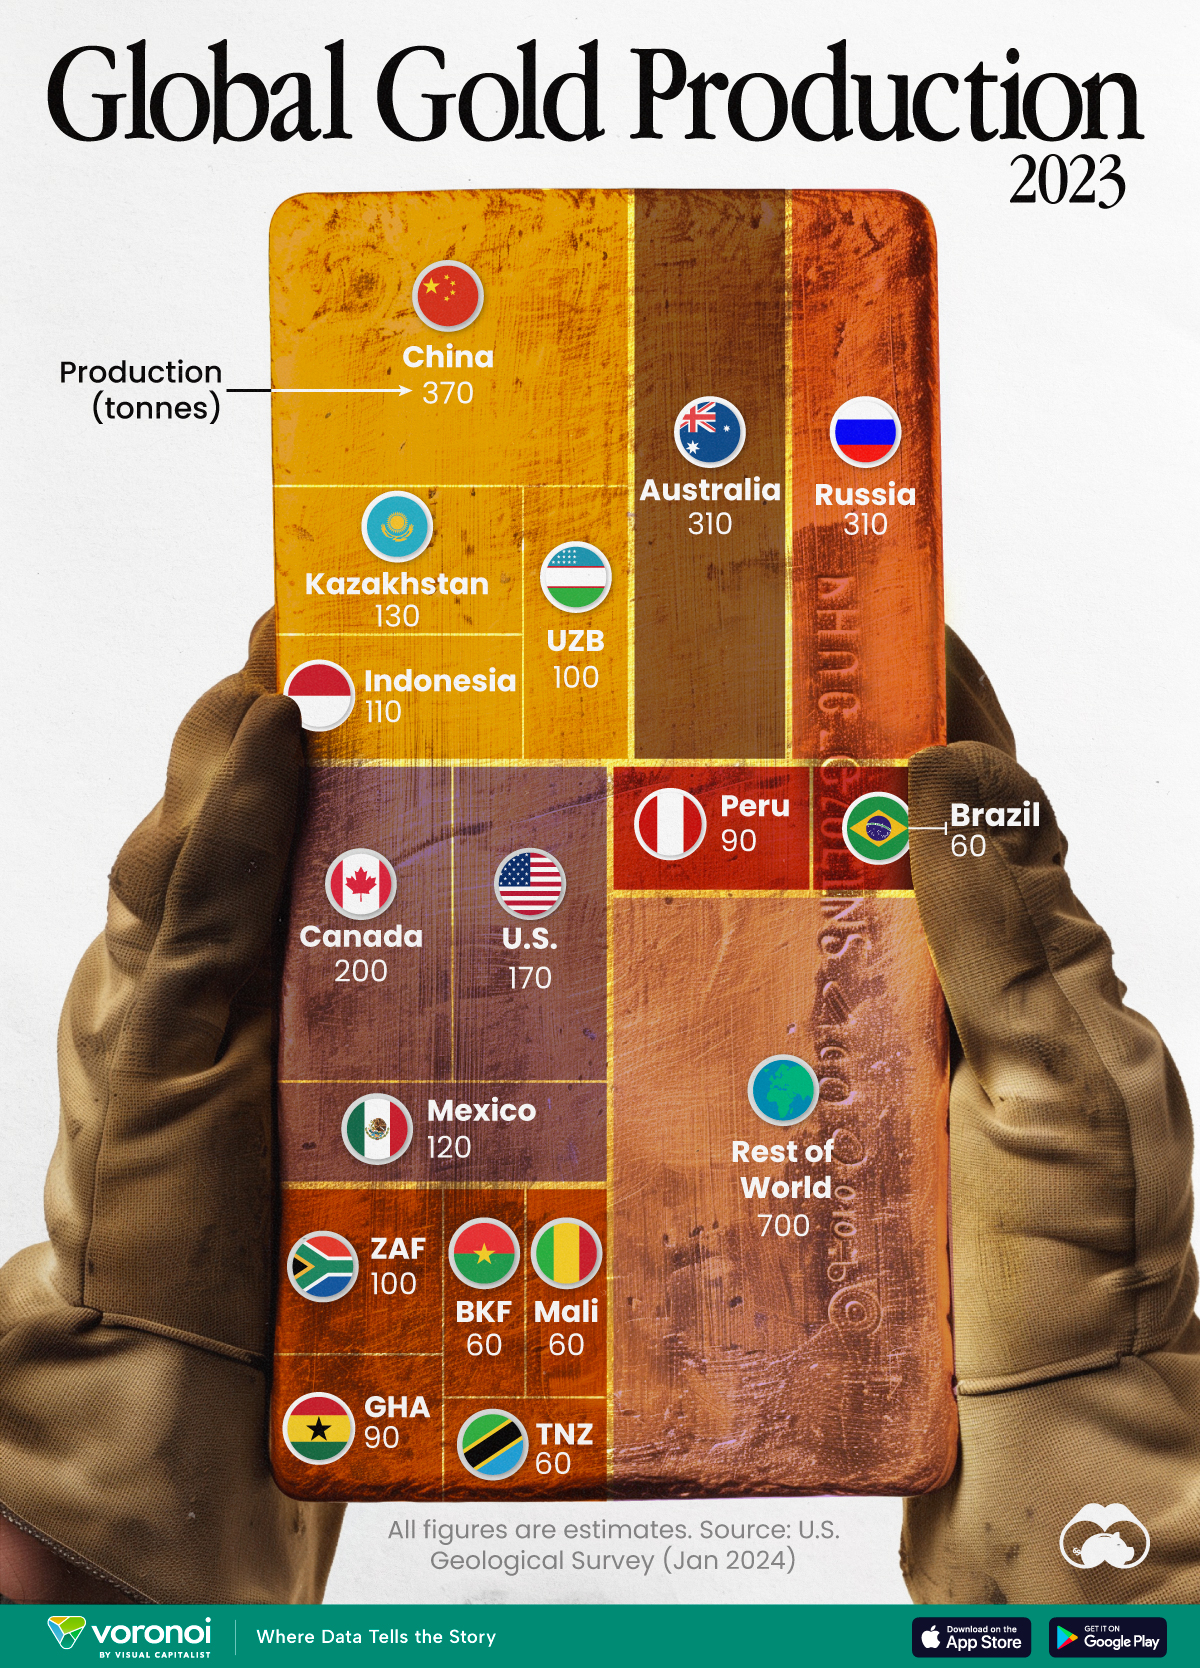
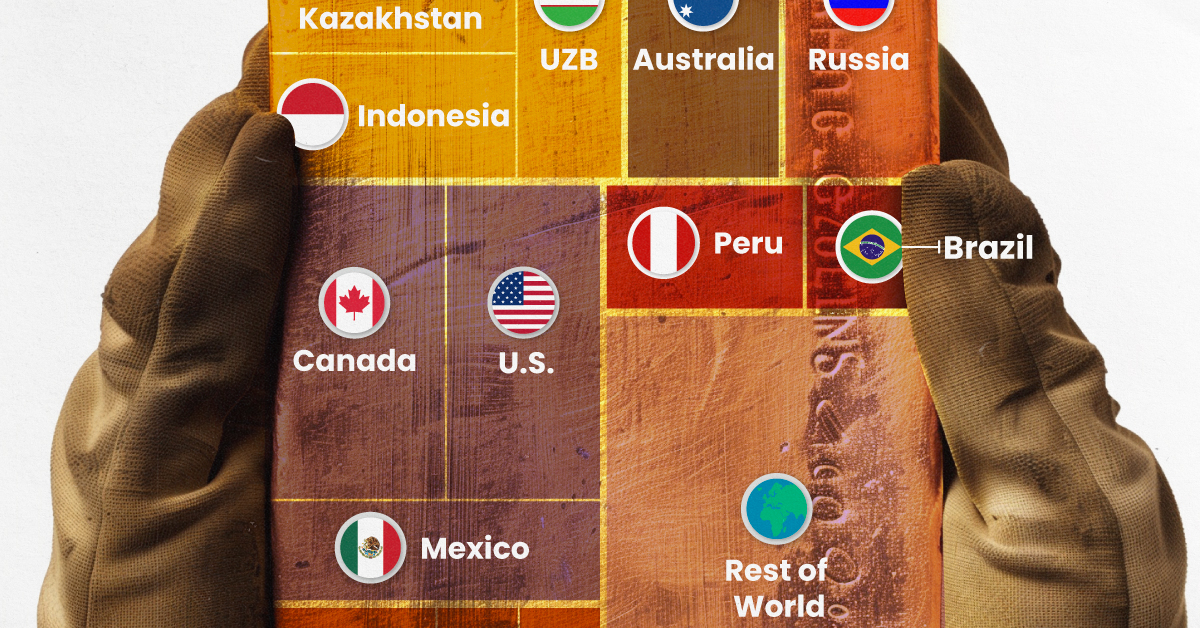
Visualizing Global Gold Production in 2023
Gold production in 2023 was led by China, Australia, and Russia, with each outputting over 300 tonnes.
Visualizing Global Gold Production in 2023
This was originally posted on our Voronoi app. Download the app for free on iOS or Android and discover incredible data-driven charts from a variety of trusted sources.
Over 3,000 tonnes of gold were produced globally in 2023.
In this graphic, we list the world’s leading countries in terms of gold production. These figures come from the latest USGS publication on gold statistics (published January 2024).
China, Australia, and Russia Produced the Most Gold in 2023
China was the top producer in 2023, responsible for over 12% of total global production, followed by Australia and Russia.
| Country | Region | 2023E Production (tonnes) |
|---|---|---|
| 🇨🇳 China | Asia | 370 |
| 🇦🇺 Australia | Oceania | 310 |
| 🇷🇺 Russia | Europe | 310 |
| 🇨🇦 Canada | North America | 200 |
| 🇺🇸 United States | North America | 170 |
| 🇰🇿 Kazakhstan | Asia | 130 |
| 🇲🇽 Mexico | North America | 120 |
| 🇮🇩 Indonesia | Asia | 110 |
| 🇿🇦 South Africa | Africa | 100 |
| 🇺🇿 Uzbekistan | Asia | 100 |
| 🇬🇭 Ghana | Africa | 90 |
| 🇵🇪 Peru | South America | 90 |
| 🇧🇷 Brazil | South America | 60 |
| 🇧🇫 Burkina Faso | Africa | 60 |
| 🇲🇱 Mali | Africa | 60 |
| 🇹🇿 Tanzania | Africa | 60 |
| 🌍 Rest of World | - | 700 |
Gold mines in China are primarily concentrated in eastern provinces such as Shandong, Henan, Fujian, and Liaoning. As of January 2024, China’s gold mine reserves stand at an estimated 3,000 tonnes, representing around 5% of the global total of 59,000 tonnes.
In addition to being the top producer, China emerged as the largest buyer of the yellow metal for the year. In fact, the country’s central bank alone bought 225 tonnes of gold in 2023, according the World Gold Council.
Estimated Global Gold Consumption
Most of the gold produced in 2023 was used in jewelry production, while another significant portion was sold as a store of value, such as in gold bars or coins.
- Jewelry: 46%
- Central Banks and Institutions: 23%
- Physical Bars: 16%
- Official Coins, Medals, and Imitation Coins: 9%
- Electrical and Electronics: 5%
- Other: 1%
According to Fitch Solutions, over the medium term (2023-2032), global gold mine production is expected to grow 15%, as high prices encourage investment and output.

-

 Money6 days ago
Charted: Which Country Has the Most Billionaires in 2024?
-

 Energy2 weeks ago
Ranked: The Top 10 EV Battery Manufacturers in 2023
-

 Countries2 weeks ago
Countries With the Largest Happiness Gains Since 2010
-

 Economy2 weeks ago
VC+: Get Our Key Takeaways From the IMF’s World Economic Outlook
-

 Demographics2 weeks ago
The Countries That Have Become Sadder Since 2010
-

 Money2 weeks ago
Charted: Who Has Savings in This Economy?
-

 Technology2 weeks ago
Visualizing AI Patents by Country
-

 Economy1 week ago
Economic Growth Forecasts for G7 and BRICS Countries in 2024