Markets
Walmart’s Domination of the U.S. Grocery Market
Walmart’s Domination of the U.S. Grocery Market
One wouldn’t expect the grocery department of a big box retailer to spark debate, but Walmart’s high market concentration in the grocery space is doing just that.
By now, Walmart’s rise to the top of the retail pyramid is well documented. The Supercenters that dot the American landscape have had a dramatic ripple effect on surrounding communities, often resulting in decreased competition and reduced selection for consumers. Today, in some communities, Walmart takes in a whopping $19 for every $20 spent on groceries.
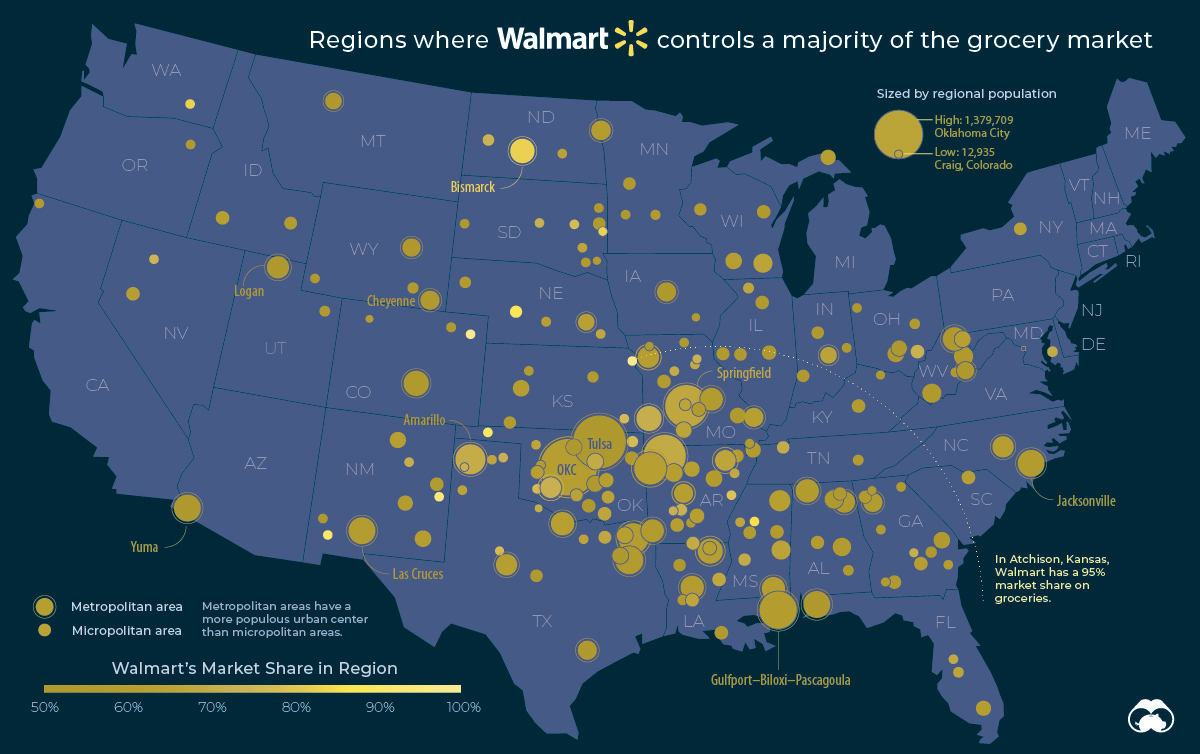
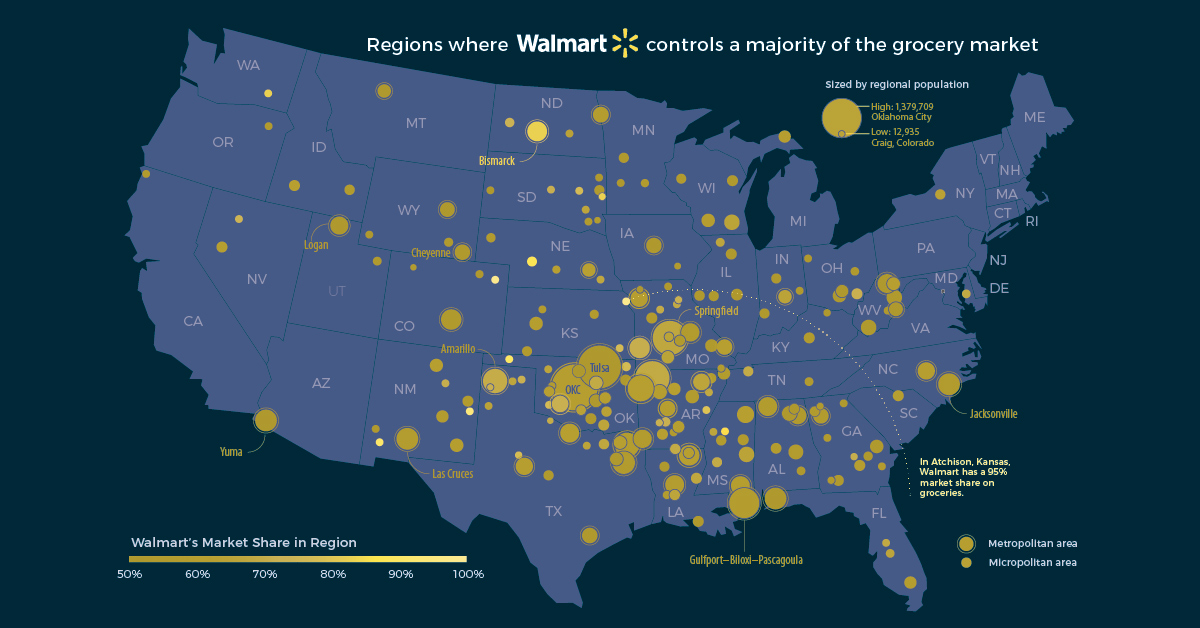
Today’s map, based on a report from the Institute for Local Self-Reliance, looks at which places in America are most reliant on Walmart to put food on the table.
The Weight of Walmart
Walmart has an unprecedented amount of control over the food system, now capturing a quarter of every single dollar spent on groceries in the United States.
Walmart isn’t just a major player — in some cases it’s become the only game in town. In a few of the communities listed in the report, Walmart commands a 90% market share and higher.
Here’s a breakdown of the top 20 towns dominated by Walmart in America:
| Rank | Metro/Region | Population | Walmart Market Share |
|---|---|---|---|
| #1 | Atchison, Kansas | 16,580 | 95% |
| #2 | Portales, New Mexico | 19,730 | 95% |
| #3 | Sterling, Colorado | 22,068 | 91% |
| #4 | Deming, New Mexico | 24,699 | 90% |
| #5 | Guymon, Oklahoma | 21,385 | 90% |
| #6 | North Platte, Nebraska | 37,043 | 87% |
| #7 | Wahpeton, N.D.– Minnesota | 23,036 | 84% |
| #8 | Coffeyville, Kansas | 33,434 | 83% |
| #9 | Othello, Washington | 19,806 | 83% |
| #10 | Bismarck, North Dakota | 135,654 | 83% |
| #11 | Helena-West Helena, Arkansas | 20,176 | 80% |
| #12 | Altus, Oklahoma | 25,931 | 77% |
| #13 | Parsons, Kansas | 20,761 | 77% |
| #14 | Miami, Oklahoma | 32,260 | 77% |
| #15 | Sweetwater, Texas | 15,101 | 77% |
| #16 | Grenada, Mississippi | 21,706 | 76% |
| #17 | Huron, South Dakota | 18,082 | 75% |
| #18 | Greensburg, Indiana | 26,711 | 74% |
| #19 | Clarksdale, Mississippi | 25,085 | 74% |
| #20 | Dumas, Texas | 22,485 | 74% |
While it’s more likely for a small town to become dominated by a single grocer, Walmart’s clout isn’t exclusive to rural America. Even in Springfield, Missouri — with a regional population of half a million people — the big box retailer still boasts a sizable market share of 66%.
Super Market Concentration
Under guidelines established by the Justice Department’s Antitrust Division, markets in which one corporation captures more than 50% of revenue are defined as “highly concentrated.” Walmart’s market share meets or exceeds this measure in 43 metropolitan areas and 160 smaller markets around the United States.
In some states, this trend is even more pronounced. In Oklahoma, for example, 86% of the state’s population lives in a region where Walmart has the majority market share in the grocery sector. In Arkansas — the home state of the megaretailer — half the population lives in this “highly concentrated” grocery market situation.
This degree of market concentration means that a retailer could cut certain products or manipulate prices without fear of losing customers. Worse yet, a company could close up shop and leave thousands of people without adequate grocery access.
An Interesting Caveat
There is a flip side to this story, however.
Walmart has shown a willingness to expand their grocery business to areas that were considered “food deserts” (i.e. low-income areas without easy access to a supermarket).
In a 2011 initiative, the retailer committed to open or expand 1,500 supermarkets across America to help give more people access to fresh food.
With the ground game clearly won, America’s largest grocer is now focused on dominating the next frontier of the grocery market – delivery. Stiff competition from companies like Amazon and Instacart will keep Walmart’s online market concentration in check for the time being.


Markets
Mapped: Europe’s GDP Per Capita, by Country
Which European economies are richest on a GDP per capita basis? This map shows the results for 44 countries across the continent.


Mapped: Europe’s GDP Per Capita, by Country (2024)
This was originally posted on our Voronoi app. Download the app for free on iOS or Android and discover incredible data-driven charts from a variety of trusted sources.
Europe is home to some of the largest and most sophisticated economies in the world. But how do countries in the region compare with each other on a per capita productivity basis?
In this map, we show Europe’s GDP per capita levels across 44 nations in current U.S. dollars. Data for this visualization and article is sourced from the International Monetary Fund (IMF) via their DataMapper tool, updated April 2024.
Europe’s Richest and Poorest Nations, By GDP Per Capita
Luxembourg, Ireland, and Switzerland, lead the list of Europe’s richest nations by GDP per capita, all above $100,000.
| Rank | Country | GDP Per Capita (2024) |
|---|---|---|
| 1 | 🇱🇺 Luxembourg | $131,380 |
| 2 | 🇮🇪 Ireland | $106,060 |
| 3 | 🇨🇭 Switzerland | $105,670 |
| 4 | 🇳🇴 Norway | $94,660 |
| 5 | 🇮🇸 Iceland | $84,590 |
| 6 | 🇩🇰 Denmark | $68,900 |
| 7 | 🇳🇱 Netherlands | $63,750 |
| 8 | 🇸🇲 San Marino | $59,410 |
| 9 | 🇦🇹 Austria | $59,230 |
| 10 | 🇸🇪 Sweden | $58,530 |
| 11 | 🇧🇪 Belgium | $55,540 |
| 12 | 🇫🇮 Finland | $55,130 |
| 13 | 🇩🇪 Germany | $54,290 |
| 14 | 🇬🇧 UK | $51,070 |
| 15 | 🇫🇷 France | $47,360 |
| 16 | 🇦🇩 Andorra | $44,900 |
| 17 | 🇲🇹 Malta | $41,740 |
| 18 | 🇮🇹 Italy | $39,580 |
| 19 | 🇨🇾 Cyprus | $37,150 |
| 20 | 🇪🇸 Spain | $34,050 |
| 21 | 🇸🇮 Slovenia | $34,030 |
| 22 | 🇪🇪 Estonia | $31,850 |
| 23 | 🇨🇿 Czech Republic | $29,800 |
| 24 | 🇵🇹 Portugal | $28,970 |
| 25 | 🇱🇹 Lithuania | $28,410 |
| 26 | 🇸🇰 Slovakia | $25,930 |
| 27 | 🇱🇻 Latvia | $24,190 |
| 28 | 🇬🇷 Greece | $23,970 |
| 29 | 🇭🇺 Hungary | $23,320 |
| 30 | 🇵🇱 Poland | $23,010 |
| 31 | 🇭🇷 Croatia | $22,970 |
| 32 | 🇷🇴 Romania | $19,530 |
| 33 | 🇧🇬 Bulgaria | $16,940 |
| 34 | 🇷🇺 Russia | $14,390 |
| 35 | 🇹🇷 Türkiye | $12,760 |
| 36 | 🇲🇪 Montenegro | $12,650 |
| 37 | 🇷🇸 Serbia | $12,380 |
| 38 | 🇦🇱 Albania | $8,920 |
| 39 | 🇧🇦 Bosnia & Herzegovina | $8,420 |
| 40 | 🇲🇰 North Macedonia | $7,690 |
| 41 | 🇧🇾 Belarus | $7,560 |
| 42 | 🇲🇩 Moldova | $7,490 |
| 43 | 🇽🇰 Kosovo | $6,390 |
| 44 | 🇺🇦 Ukraine | $5,660 |
| N/A | 🇪🇺 EU Average | $44,200 |
Note: Figures are rounded.
Three Nordic countries (Norway, Iceland, Denmark) also place highly, between $70,000-90,000. Other Nordic peers, Sweden and Finland rank just outside the top 10, between $55,000-60,000.
Meanwhile, Europe’s biggest economies in absolute terms, Germany, UK, and France, rank closer to the middle of the top 20, with GDP per capitas around $50,000.
Finally, at the end of the scale, Eastern Europe as a whole tends to have much lower per capita GDPs. In that group, Ukraine ranks last, at $5,660.
A Closer Look at Ukraine
For a broader comparison, Ukraine’s per capita GDP is similar to Iran ($5,310), El Salvador ($5,540), and Guatemala ($5,680).
According to experts, Ukraine’s economy has historically underperformed to expectations. After the fall of the Berlin Wall, the economy contracted for five straight years. Its transition to a Western, liberalized economic structure was overshadowed by widespread corruption, a limited taxpool, and few revenue sources.
Politically, its transformation from authoritarian regime to civil democracy has proved difficult, especially when it comes to institution building.
Finally, after the 2022 invasion of the country, Ukraine’s GDP contracted by 30% in a single year—the largest loss since independence. Large scale emigration—to the tune of six million refugees—is also playing a role.
Despite these challenges, the country’s economic growth has somewhat stabilized while fighting continues.

-

 Healthcare6 days ago
Life Expectancy by Region (1950-2050F)
-

 Economy2 weeks ago
Ranked: The Top 20 Countries in Debt to China
-

 Politics2 weeks ago
Charted: Trust in Government Institutions by G7 Countries
-

 Energy2 weeks ago
Mapped: The Age of Energy Projects in Interconnection Queues, by State
-

 Mining2 weeks ago
Visualizing Global Gold Production in 2023
-

 Markets2 weeks ago
Visualized: Interest Rate Forecasts for Advanced Economies
-

 Economy1 week ago
The Most Valuable Companies in Major EU Economies
-

 Markets1 week ago
The World’s Fastest Growing Emerging Markets (2024-2029 Forecast)