Misc
Visualizing the Odds of Dying from Various Accidents
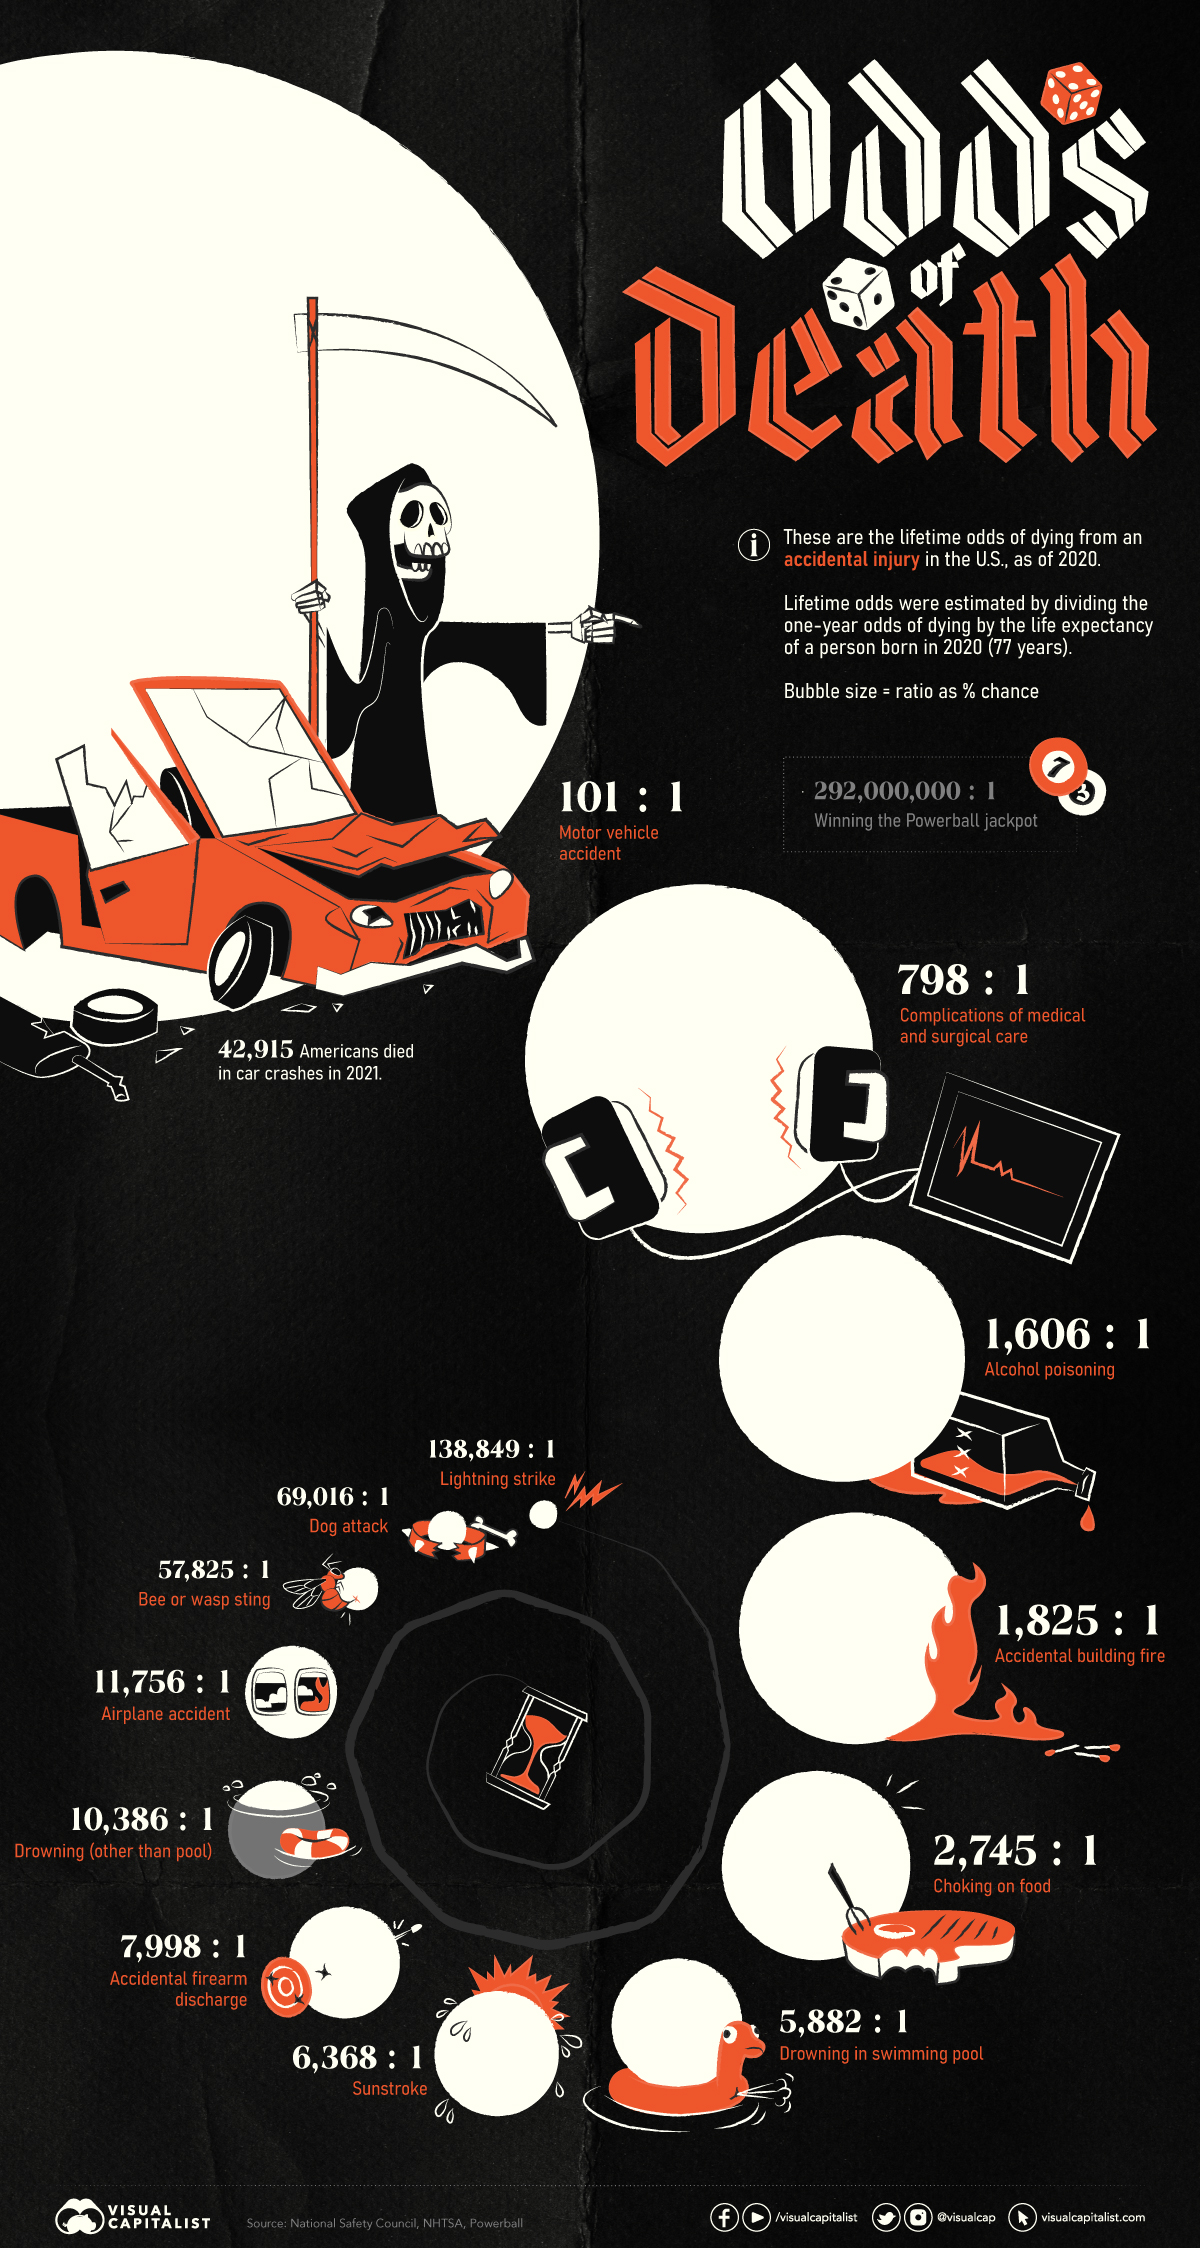


Infographic: The Odds of Dying from Various Accidents
Fatal accidents account for a significant number of deaths in the U.S. every year. For example, nearly 43,000 Americans died in traffic accidents in 2021.
Without the right context, however, it can be difficult to properly interpret these figures.
To help you understand your chances, we’ve compiled data from the National Safety Council, and visualized the lifetime odds of dying from various accidents.
Data and Methodology
The lifetime odds presented in this graphic were estimated by dividing the one-year odds of dying by the life expectancy of a person born in 2020 (77 years).
Additionally, these numbers are based on data from the U.S., and likely differ in other countries.
| Type of Accident | Lifetime odds of dying (1 in #) |
|---|---|
| Motor vehicle accident | 101 |
| Complications of medical and surgical care | 798 |
| Alcohol poisoning | 1,606 |
| Accidental building fire | 1,825 |
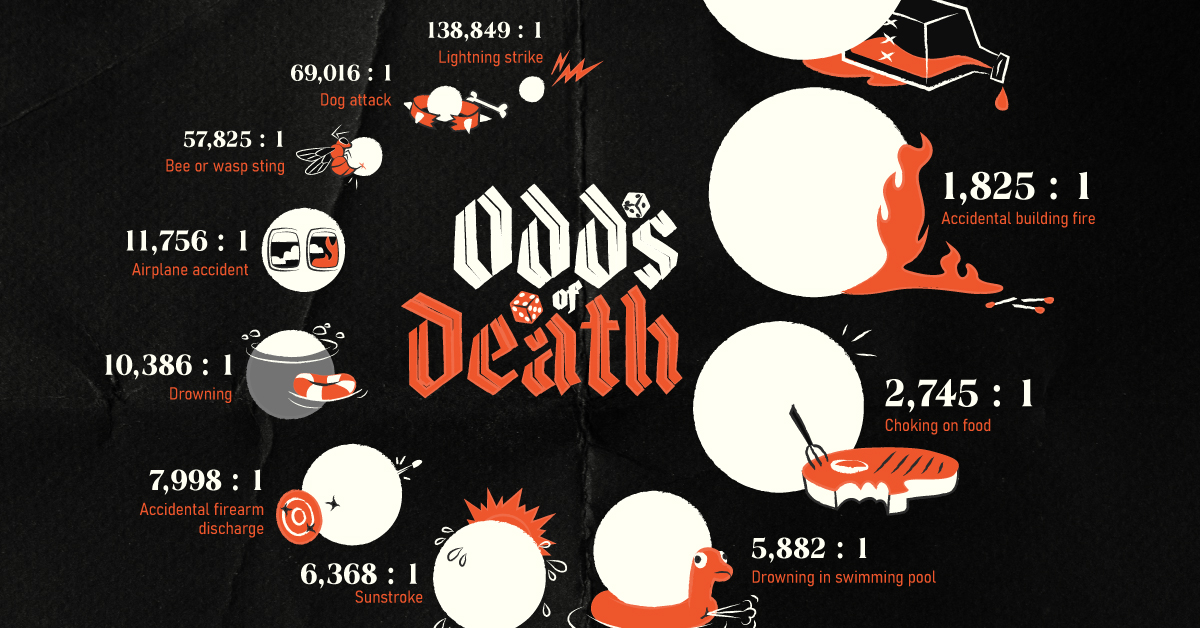
| Choking on food | 2,745 |
| Drowning in swimming pool | 5,782 |
| Sunstroke | 6,368 |
| Accidental firearm discharge | 7,998 |
| Drowning | 10,386 |
| Airplane accident | 11,756 |
| Bee or wasp sting | 57,825 |
| Dog attack | 69,016 |
| Lightning strike | 138,849 |
For comparison’s sake, the odds of winning the Powerball jackpot are 1 in 292,000,000. In other words, you are 4000x more likely to die by a lightning strike over your lifetime than to win the Powerball lottery.
Continue reading below for further context on some of these accidents.
Motor Vehicle Accidents
Motor vehicle accidents are a leading cause of accidental deaths in the U.S., with a 1 in 101 chance of dying. This is quite a common way of dying, especially when compared to something like bee stings (1 in 57,825).
Unfortunately, a major cause of vehicle deaths is impaired driving. The CDC reports that 32 Americans are killed every day in crashes involving alcohol, which equates to one death every 45 minutes.
For further context, consider this: 30% of all traffic-related deaths in 2020 involved alcohol-impaired drivers.
Drowning
The odds of drowning in a swimming pool (1 in 5,782) are significantly higher than those of drowning in general (1 in 10,386). According to the CDC, there are 4,000 fatal drownings every year, which works out to 11 deaths per day.
Drowning also happens to be a leading cause of death for children. It is the leading cause for kids aged 1-4, and second highest cause for kids aged 5-14.
A rather surprising fact about drowning is that 80% of fatalities are male. This has been attributed to higher rates of alcohol use and risk-taking behaviors.
Accidental Firearm Discharge
Lastly, let’s look at accidental firearm deaths, which have lifetime odds of 1 in 7,998. That’s higher than the odds of drowning (general), as well as dying in an airplane accident.
This shouldn’t come as a major surprise, since the U.S. has the highest rates of gun ownership in the world. More importantly, these odds highlight the importance of properly securing one’s firearms, as well as learning safe handling practices.
As a percentage of total gun-related deaths (45,222 in 2020), accidental shootings represent a tiny 1%. The two leading causes are suicide (54%) and homicide (43%).
Interested in learning more about death? Revisit one of our most popular posts of all time: Visualizing the History of Pandemics.


VC+
VC+: Get Our Key Takeaways From the IMF’s World Economic Outlook
A sneak preview of the exclusive VC+ Special Dispatch—your shortcut to understanding IMF’s World Economic Outlook report.

Have you read IMF’s latest World Economic Outlook yet? At a daunting 202 pages, we don’t blame you if it’s still on your to-do list.
But don’t worry, you don’t need to read the whole April release, because we’ve already done the hard work for you.
To save you time and effort, the Visual Capitalist team has compiled a visual analysis of everything you need to know from the report—and our VC+ Special Dispatch is available exclusively to VC+ members. All you need to do is log into the VC+ Archive.
If you’re not already subscribed to VC+, make sure you sign up now to access the full analysis of the IMF report, and more (we release similar deep dives every week).
For now, here’s what VC+ members get to see.
Your Shortcut to Understanding IMF’s World Economic Outlook
With long and short-term growth prospects declining for many countries around the world, this Special Dispatch offers a visual analysis of the key figures and takeaways from the IMF’s report including:
- The global decline in economic growth forecasts
- Real GDP growth and inflation forecasts for major nations in 2024
- When interest rate cuts will happen and interest rate forecasts
- How debt-to-GDP ratios have changed since 2000
- And much more!

Get the Full Breakdown in the Next VC+ Special Dispatch
VC+ members can access the full Special Dispatch by logging into the VC+ Archive, where you can also check out previous releases.
Make sure you join VC+ now to see exclusive charts and the full analysis of key takeaways from IMF’s World Economic Outlook.
Don’t miss out. Become a VC+ member today.
What You Get When You Become a VC+ Member
VC+ is Visual Capitalist’s premium subscription. As a member, you’ll get the following:
- Special Dispatches: Deep dive visual briefings on crucial reports and global trends
- Markets This Month: A snappy summary of the state of the markets and what to look out for
- The Trendline: Weekly curation of the best visualizations from across the globe
- Global Forecast Series: Our flagship annual report that covers everything you need to know related to the economy, markets, geopolitics, and the latest tech trends
- VC+ Archive: Hundreds of previously released VC+ briefings and reports that you’ve been missing out on, all in one dedicated hub
You can get all of the above, and more, by joining VC+ today.

-

 Energy1 week ago
The World’s Biggest Nuclear Energy Producers
-

 Money2 weeks ago
Which States Have the Highest Minimum Wage in America?
-

 Technology2 weeks ago
Ranked: Semiconductor Companies by Industry Revenue Share
-

 Markets2 weeks ago
Ranked: The World’s Top Flight Routes, by Revenue
-

 Demographics2 weeks ago
Population Projections: The World’s 6 Largest Countries in 2075
-

 Markets2 weeks ago
The Top 10 States by Real GDP Growth in 2023
-

 Demographics2 weeks ago
The Smallest Gender Wage Gaps in OECD Countries
-

 United States2 weeks ago
Where U.S. Inflation Hit the Hardest in March 2024