Green
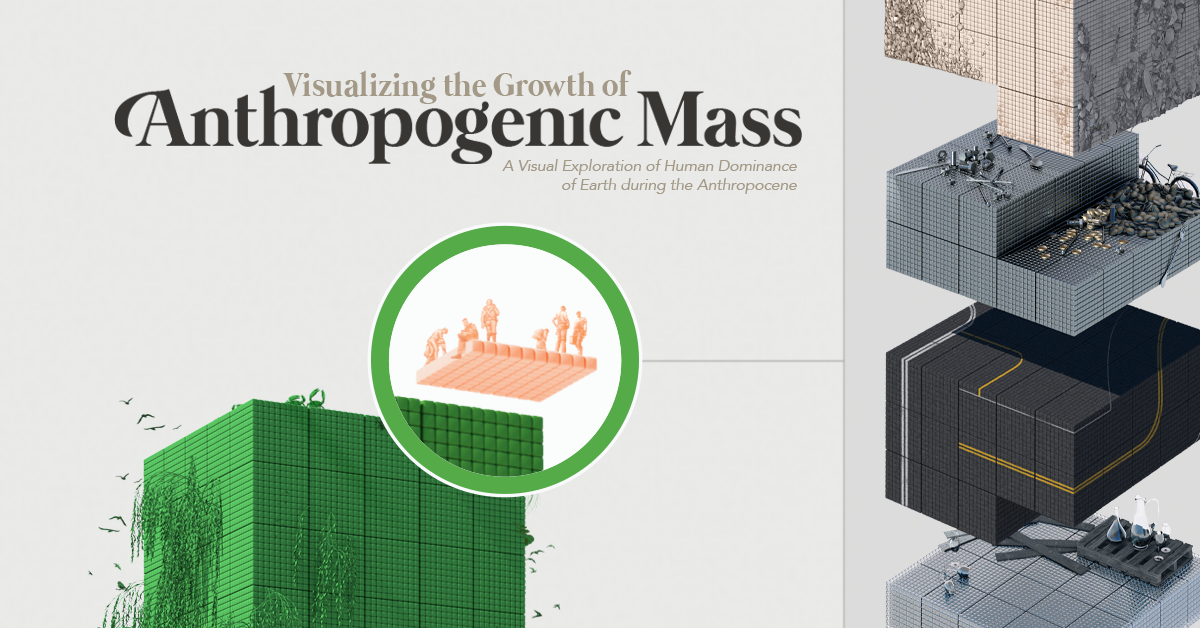
Visualizing the Accumulation of Human-Made Mass on Earth
![]() Subscribe to the Elements free mailing list for more like this
Subscribe to the Elements free mailing list for more like this


Visualizing the Accumulation of Human-Made Mass on Earth
This was originally posted on Elements. Sign up to the free mailing list to get beautiful visualizations on natural resource megatrends in your email every week.
The world is not getting any bigger but the human population continues to grow, consuming more and more resources and altering the very environment we rely on.
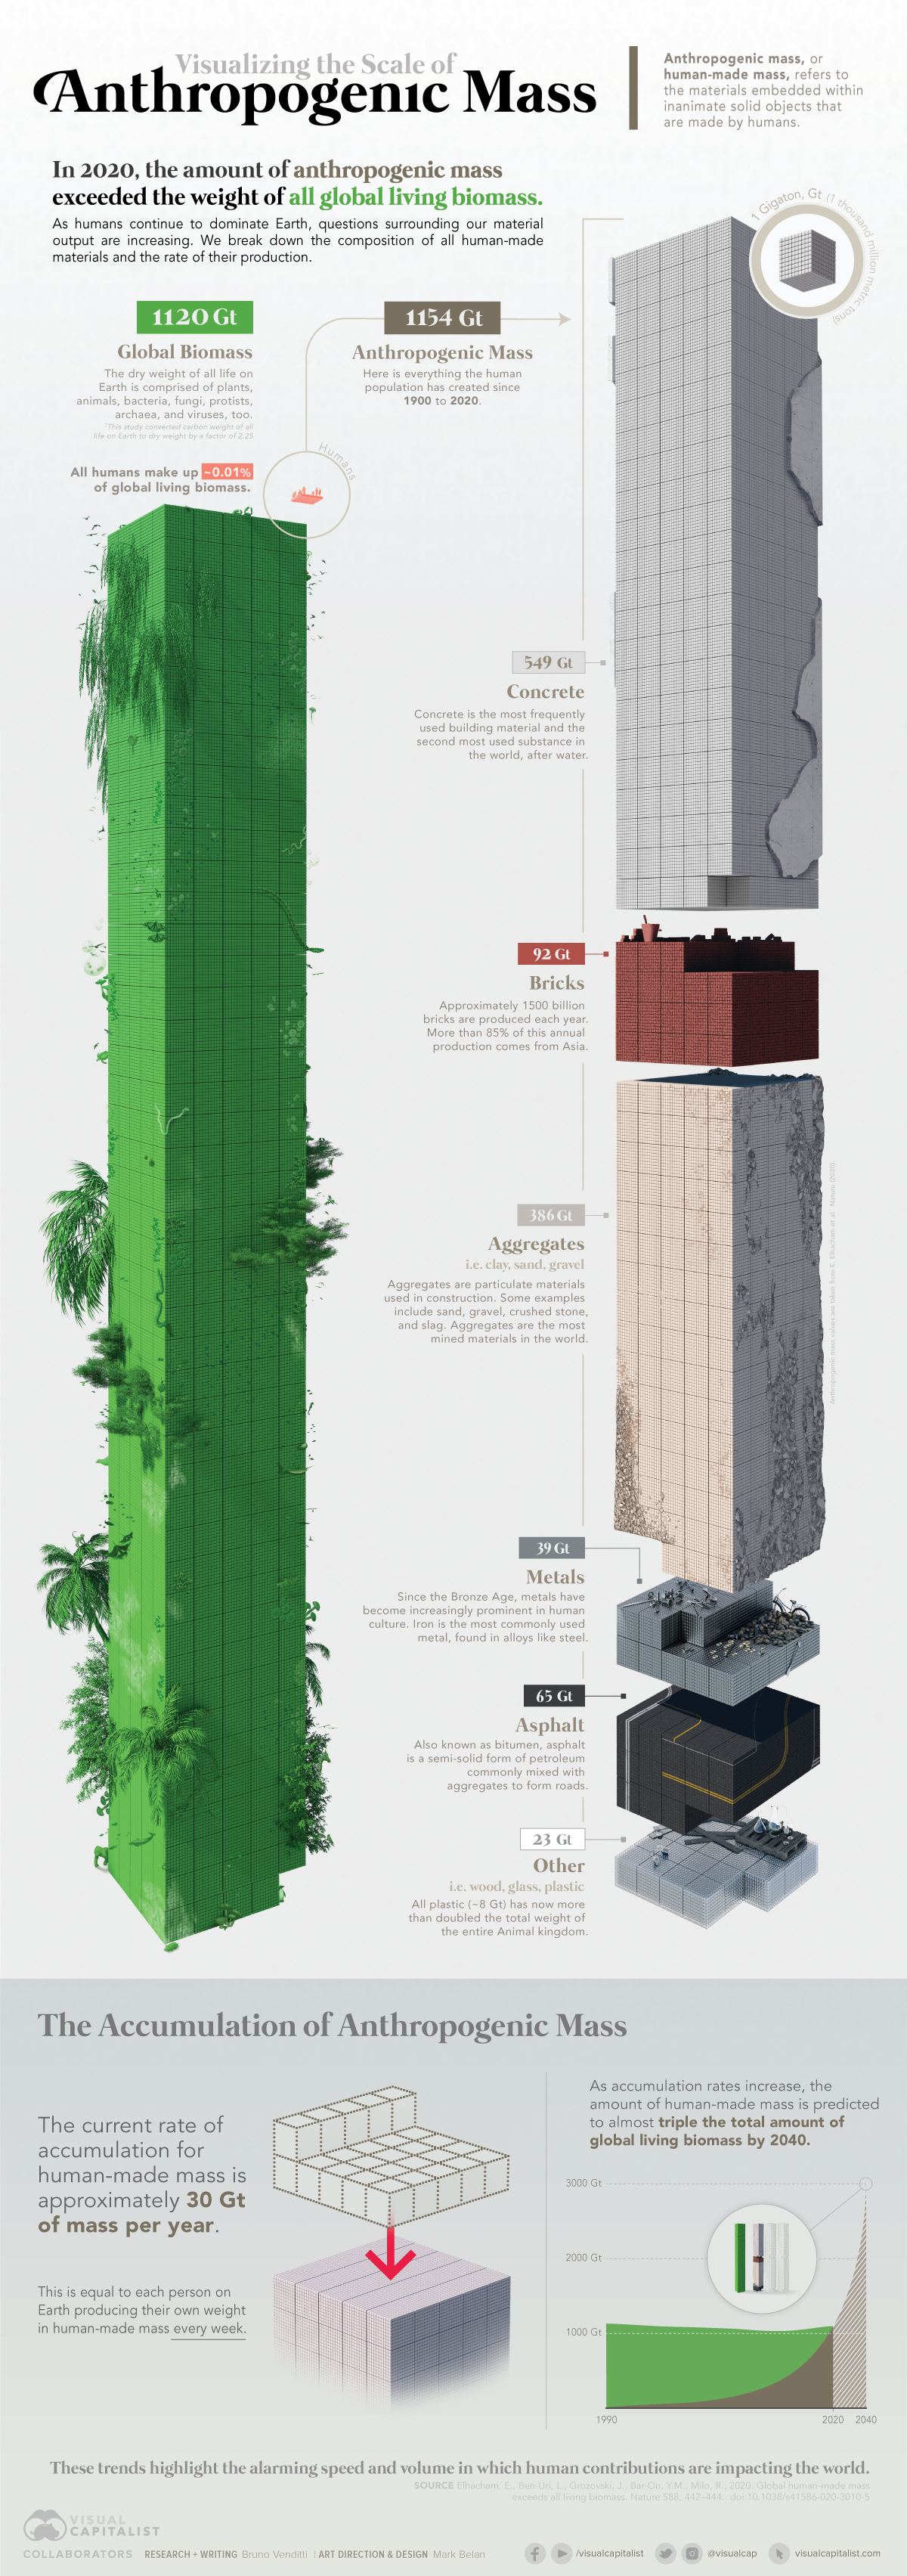
In 2020, the amount of human-made mass, or anthropogenic mass, exceeded for the first time the dry weight (except for water and fluids) of all life on Earth, including humans, animals, plants, fungi, and even microorganisms.
In this infographic based on a study published in Nature, we break down the composition of all human-made materials and the rate of their production.
A Man-made Planet
Anthropogenic mass is defined as the mass embedded in inanimate solid objects made by humans that have not been demolished or taken out of service—which is separately defined as anthropogenic mass waste.
Over the past century or so, human-made mass has increased rapidly, doubling approximately every 20 years. The collective mass of these materials has gone from 3% of the world’s biomass in 1900 to being on par with it today.
While we often overlook the presence of raw materials, they are what make the modern economy possible. To build roads, houses, buildings, printer paper, coffee mugs, computers, and all other human-made things, it requires billions of tons of fossil fuels, metals and minerals, wood, and agricultural products.
Human-Made Mass
Every year, we extract almost 90 billion tons of raw materials from the Earth. A single smartphone, for example, can carry roughly 80% of the stable elements on the periodic table.
The rate of accumulation for anthropogenic mass has now reached 30 gigatons (Gt)—equivalent to 30 billion metric tons—per year, based on the average for the past five years. This corresponds to each person on the globe producing more than his or her body weight in anthropogenic mass every week.
At the top of the list is concrete. Used for building and infrastructure, concrete is the second most used substance in the world, after water.
| Human-Made Mass | Description | 1900 (mass/Gt) | 1940 (mass/Gt) | 1980 (mass/Gt) | 2020 (mass/Gt) |
|---|---|---|---|---|---|
| Concrete | Used for building and infrastructure, including cement, gravel and sand | 2 | 10 | 86 | 549 |
| Aggregates | Gravel and sand, mainly used as bedding for roads and buildings | 17 | 30 | 135 | 386 |
| Bricks | Mostly composed of clay and used for constructions | 11 | 16 | 28 | 92 |
| Asphalt | Bitumen, gravel and sand, used mainly for road construction/pavement | 0 | 1 | 22 | 65 |
| Metals | Mostly iron/steel, aluminum and copper | 1 | 3 | 13 | 39 |
| Other | Solid wood products, paper/paperboard, container and flat glass and plastic | 4 | 6 | 11 | 23 |
Bricks and aggregates like gravel and sand also represent a big part of human-made mass.
Although small compared to other materials in our list, the mass of plastic we’ve made is greater than the overall mass of all terrestrial and marine animals combined.

As the rate of growth of human-made mass continues to accelerate, it could become triple the total amount of global living biomass by 2040.
Can We Work It Out?
While the mass of humans is only about 0.01% of all biomass, our impact is like no other form of life on Earth. We are one of the few species that can alter the environment to the point of affecting all life.
At the current pace, the reserves of some materials like fossil fuels and minerals could run out in less than 100 years. As a result, prospectors are widening their search as they seek fresh sources of raw materials, exploring places like the Arctic, the deep sea, and even asteroids.
As the world population continues to increase, so does the pressure on the natural environment. It is an unavoidable fact that consumption will increase, but in an era of net-zero policies and carbon credits, accounting for the human impact on the environment will be more important than ever.


Green
The Carbon Footprint of Major Travel Methods
Going on a cruise ship and flying domestically are the most carbon-intensive travel methods.


The Carbon Footprint of Major Travel Methods
This was originally posted on our Voronoi app. Download the app for free on iOS or Android and discover incredible data-driven charts from a variety of trusted sources.
Did you know that transport accounts for nearly one-quarter of global energy-related carbon dioxide (CO₂) emissions?
This graphic illustrates the carbon footprints of major travel methods measured in grams of carbon dioxide equivalent (CO₂e) emitted per person to travel one kilometer. This includes both CO₂ and other greenhouse gases.
Data is sourced from Our World in Data, the UK Government’s Department for Energy Security and Net Zero, and The International Council on Clean Transportation, as of December 2022.
These figures should be interpreted as approximations, rather than exact numbers. There are many variables at play that determine the actual carbon footprint in any individual case, including vehicle type or model, occupancy, energy mix, and even weather.
Cruise Ships are the Most Carbon-Intensive Travel Method
According to these estimates, taking a cruise ship, flying domestically, and driving alone are some of the most carbon-intensive travel methods.
Cruise ships typically use heavy fuel oil, which is high in carbon content. The average cruise ship weighs between 70,000 to 180,000 metric tons, meaning they require large engines to get moving.
These massive vessels must also generate power for onboard amenities such as lighting, air conditioning, and entertainment systems.
Short-haul flights are also considered carbon-intensive due to the significant amount of fuel consumed during initial takeoff and climbing altitude, relative to a lower amount of cruising.
| Transportation method | CO₂ equivalent emissions per passenger km |
|---|---|
| Cruise Ship | 250 |
| Short-haul flight (i.e. within a U.S. state or European country) | 246 |
| Diesel car | 171 |
| Gas car | 170 |
| Medium-haul flight (i.e. international travel within Europe, or between U.S. states) | 151 |
| Long-haul flight (over 3,700 km, about the distance from LA to NY) | 147 |
| Motorbike | 113 |
| Bus (average) | 96 |
| Plug-in hybrid | 68 |
| Electric car | 47 |
| National rail | 35 |
| Tram | 28 |
| London Underground | 27 |
| Ferry (foot passenger) | 19 |
| Eurostar (International rail) | 4.5 |
Are EVs Greener?
Many experts agree that EVs produce a lower carbon footprint over time versus traditional internal combustion engine (ICE) vehicles.
However, the batteries in electric vehicles charge on the power that comes straight off the electrical grid—which in many places may be powered by fossil fuels. For that reason, the carbon footprint of an EV will depend largely on the blend of electricity sources used for charging.
There are also questions about how energy-intensive it is to build EVs compared to a comparable ICE vehicle.

-

 Markets5 days ago
The World’s Fastest Growing Emerging Markets (2024-2029 Forecast)
-

 Technology2 weeks ago
All of the Grants Given by the U.S. CHIPS Act
-

 Green2 weeks ago
The Carbon Footprint of Major Travel Methods
-

 United States2 weeks ago
Visualizing the Most Common Pets in the U.S.
-

 Culture2 weeks ago
The World’s Top Media Franchises by All-Time Revenue
-

 Visual Capitalist1 week ago
Best Visualizations of April on the Voronoi App
-

 Wealth1 week ago
Charted: Which Country Has the Most Billionaires in 2024?
-

 Markets1 week ago
The Top Private Equity Firms by Country