Technology
Visualizing the Diversity of the Tech Industry
Visualizing the Diversity of the Tech Industry
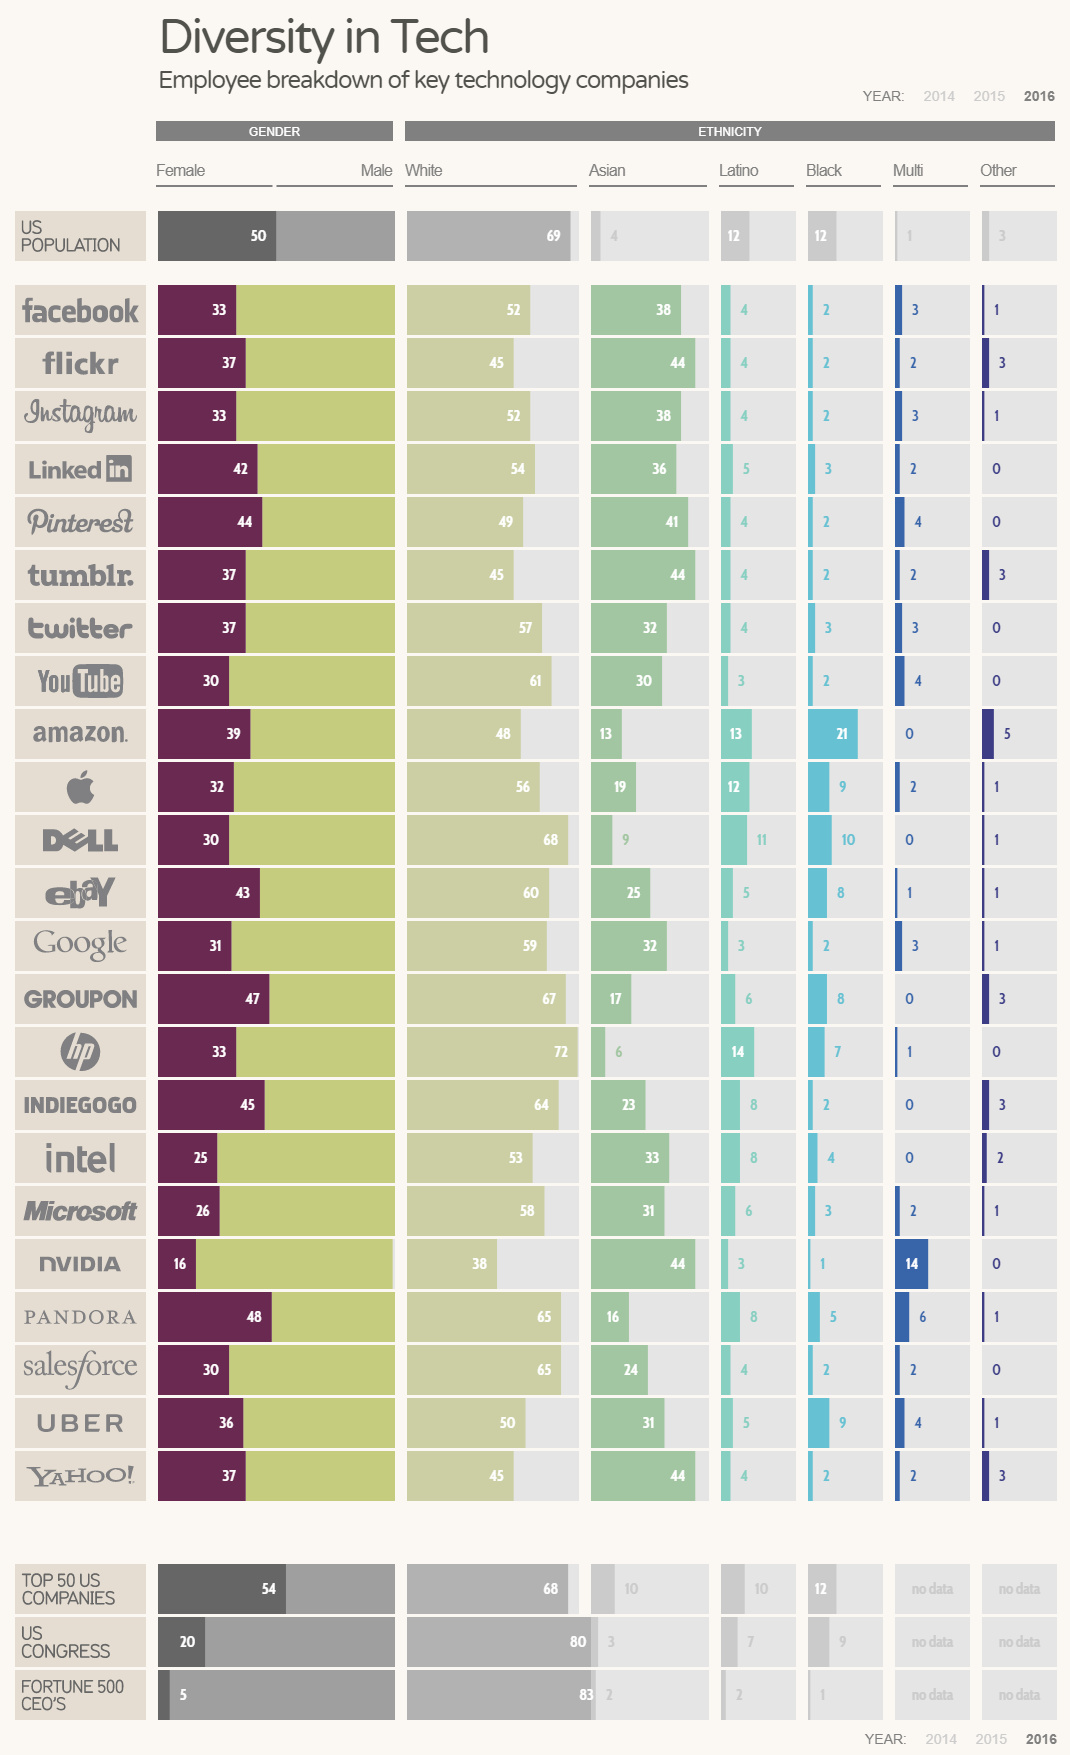
With the recent leak of the “Google Manifesto” and the maelstrom of media backlash that followed, it seems that concerns around diversity in the technology industry have finally reached a boiling point.
Today’s infographic from Information is Beautiful breaks down the demographics of 23 major tech companies, based on statistics from 2016. It also provides comparisons to the composition of the U.S. population in general, the top 50 U.S. companies, Congress, and Fortune 500 CEOs.
Which Companies Employ the Most Women?
With just a focus on the major companies on this list, here is a breakdown that shows which companies employ the most women:
| Rank | Tech Company | % of Females |
|---|---|---|
| #1 | Pandora | 48% |
| #2 | Groupon | 47% |
| #3 | Indiegogo | 45% |
| #4 | 44% | |
| #5 | eBay | 43% |
| U.S. Population Avg. | 50% |
The above list already illustrates why diversity is such a concern for many observers of the industry: even the companies with the most women on their rosters have proportions lower than U.S. population average of 50%.
In contrast, here are the companies on the list that employ the fewest women, as a proportion of their workforce:
| Rank | Tech Company | % of Females |
|---|---|---|
| #18 (t) | Salesforce | 30% |
| #18 (t) | Youtube | 30% |
| #18 (t) | Dell | 30% |
| #21 | Microsoft | 26% |
| #22 | Intel | 25% |
| #23 | Nvidia | 16% |
Google, which is at the center of debate right now, did not make the list of the companies with the fewest women – but it’s not far off with a workforce comprised of 31% women.
What’s Changed in the Last 12 Months?
According to Information is Beautiful, here is what has changed in the last 12 months as of their last update (April 2017):
- Facebook, Apple, eBay, and Microsoft all had their ratio of women increase by 1%.
- LinkedIn had their ratio of women increase by 3%.
- Google’s gender ratio stayed the same.
- Microsoft increased the ratio of non-white employees by 3%, and Facebook by 2%.
- Google, Apple, and eBay increased ratio of non-white employees by 1%.
- LinkedIn lost 3% of its non-white employees.
- Asian staff accounted for the majority of increases in ethnic diversity, while the ratio of Hispanic employees remained static.
To get an even better sense of the data, we recommend visiting the interactive version of Information is Beautiful’s graphic, which shows numbers for 2014 and 2015 as well.


Technology
All of the Grants Given by the U.S. CHIPS Act
Intel, TSMC, and more have received billions in subsidies from the U.S. CHIPS Act in 2024.


All of the Grants Given by the U.S. CHIPS Act
This was originally posted on our Voronoi app. Download the app for free on iOS or Android and discover incredible data-driven charts from a variety of trusted sources.
This visualization shows which companies are receiving grants from the U.S. CHIPS Act, as of April 25, 2024. The CHIPS Act is a federal statute signed into law by President Joe Biden that authorizes $280 billion in new funding to boost domestic research and manufacturing of semiconductors.
The grant amounts visualized in this graphic are intended to accelerate the production of semiconductor fabrication plants (fabs) across the United States.
Data and Company Highlights
The figures we used to create this graphic were collected from a variety of public news sources. The Semiconductor Industry Association (SIA) also maintains a tracker for CHIPS Act recipients, though at the time of writing it does not have the latest details for Micron.
| Company | Federal Grant Amount | Anticipated Investment From Company |
|---|---|---|
| 🇺🇸 Intel | $8,500,000,000 | $100,000,000,000 |
| 🇹🇼 TSMC | $6,600,000,000 | $65,000,000,000 |
| 🇰🇷 Samsung | $6,400,000,000 | $45,000,000,000 |
| 🇺🇸 Micron | $6,100,000,000 | $50,000,000,000 |
| 🇺🇸 GlobalFoundries | $1,500,000,000 | $12,000,000,000 |
| 🇺🇸 Microchip | $162,000,000 | N/A |
| 🇬🇧 BAE Systems | $35,000,000 | N/A |
BAE Systems was not included in the graphic due to size limitations
Intel’s Massive Plans
Intel is receiving the largest share of the pie, with $8.5 billion in grants (plus an additional $11 billion in government loans). This grant accounts for 22% of the CHIPS Act’s total subsidies for chip production.
From Intel’s side, the company is expected to invest $100 billion to construct new fabs in Arizona and Ohio, while modernizing and/or expanding existing fabs in Oregon and New Mexico. Intel could also claim another $25 billion in credits through the U.S. Treasury Department’s Investment Tax Credit.
TSMC Expands its U.S. Presence
TSMC, the world’s largest semiconductor foundry company, is receiving a hefty $6.6 billion to construct a new chip plant with three fabs in Arizona. The Taiwanese chipmaker is expected to invest $65 billion into the project.
The plant’s first fab will be up and running in the first half of 2025, leveraging 4 nm (nanometer) technology. According to TrendForce, the other fabs will produce chips on more advanced 3 nm and 2 nm processes.
The Latest Grant Goes to Micron
Micron, the only U.S.-based manufacturer of memory chips, is set to receive $6.1 billion in grants to support its plans of investing $50 billion through 2030. This investment will be used to construct new fabs in Idaho and New York.

-

 Education1 week ago
How Hard Is It to Get Into an Ivy League School?
-

 Technology2 weeks ago
Ranked: Semiconductor Companies by Industry Revenue Share
-

 Markets2 weeks ago
Ranked: The World’s Top Flight Routes, by Revenue
-

 Demographics2 weeks ago
Population Projections: The World’s 6 Largest Countries in 2075
-

 Markets2 weeks ago
The Top 10 States by Real GDP Growth in 2023
-

 Demographics2 weeks ago
The Smallest Gender Wage Gaps in OECD Countries
-

 Economy2 weeks ago
Where U.S. Inflation Hit the Hardest in March 2024
-

 Environment2 weeks ago
Top Countries By Forest Growth Since 2001