Energy
Visualizing China’s Dominance in the Solar Panel Supply Chain
![]() Subscribe to the Elements free mailing list for more like this
Subscribe to the Elements free mailing list for more like this


China’s Dominance in the Solar Panel Supply Chain
This was originally posted on Elements. Sign up to the free mailing list to get beautiful visualizations on natural resource megatrends in your email every week.
Many governments are investing in renewable energy sources like solar power, but who controls the manufacturing of solar photovoltaic (PV) panels?
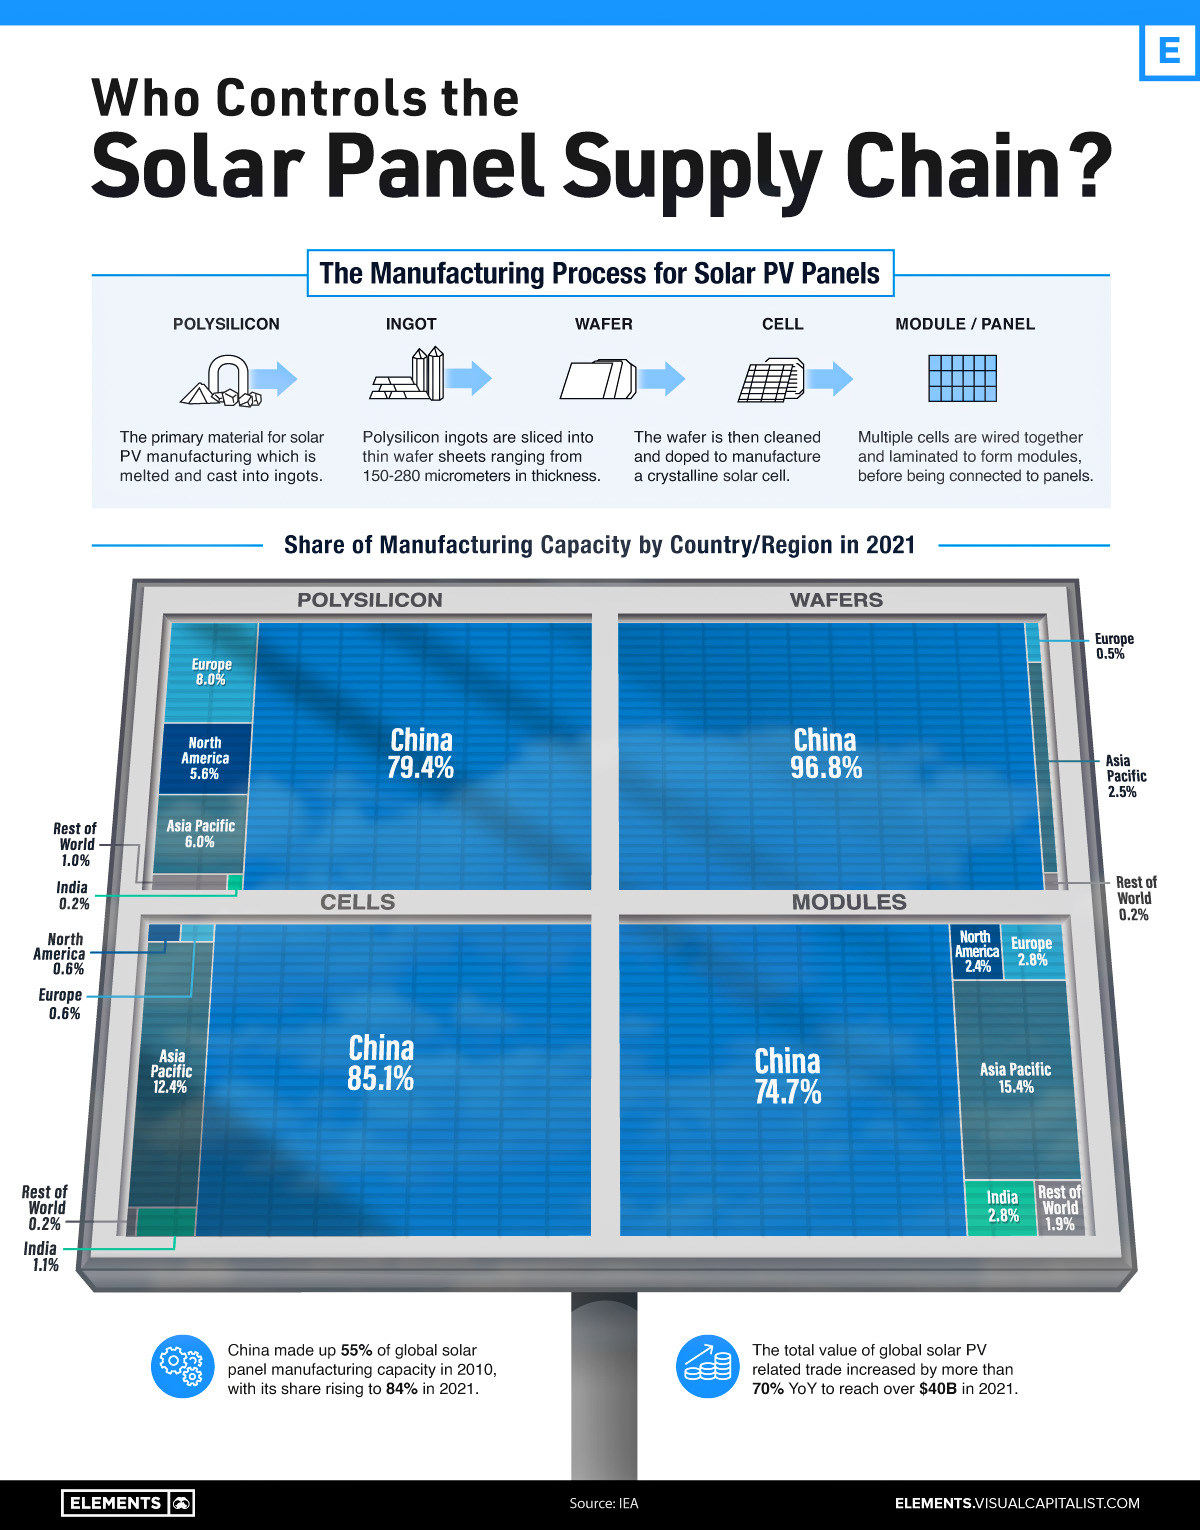
As it turns out, China owns the vast majority of the world’s solar panel supply chain, controlling at least 75% of every single key stage of solar photovoltaic panel manufacturing and processing.
This visualization shows the shares held by different countries and regions of the key stages of solar panel manufacturing, using data from the International Energy Agency (IEA).
Solar Panel Manufacturing, by Country and Stage
From polysilicon production to soldering finished solar cells and modules onto panels, China has the largest share in every stage of solar panel manufacturing.
Even back in 2010, the country made the majority of the world’s solar panels, but over the past 12 years, its average share of the solar panel supply chain has gone from 55% to 84%.
China also continues to lead in terms of investment, making up almost two-thirds of global large-scale solar investment. In the first half of 2022, the country invested $41 billion, a 173% increase from the year before.
| Country/Region | Solar Panel Demand | Average Share of Solar Panel Manufacturing Capacity |
|---|---|---|
| China | 36.4% | 84.0% |
| Europe | 16.8% | 2.9% |
| North America | 17.6% | 2.8% |
| Asia-Pacific | 13.2% | 9.1% |
| India | 6.9% | 1.3% |
| Rest of the World | 9.1% | 0.8% |
Source: IEA
Note: Percentages may not add up to 100% due to rounding
After China, the next leading nation in solar panel manufacturing is India, which makes up almost 3% of solar module manufacturing and 1% of cell manufacturing. To help meet the country’s goal of 280 gigawatts (GW) of installed solar power capacity by 2030 (currently 57.9 GW), in 2022 the Indian government allocated an additional $2.6 billion to its production-linked incentive scheme that supports domestic solar PV panel manufacturing.
Alongside China and India, the Asia-Pacific region also makes up significant amounts of solar panel manufacturing, especially modules and cells at 15.4% and 12.4% respectively.
While Europe and North America make up more than one-third of the global demand for solar panels, both regions make up an average of just under 3% each across all stages of actually manufacturing solar panels.
Too Little Too Late to Diversify?
China’s dominance of solar photovoltaic panel manufacturing is not the only stranglehold the country has on renewable energy infrastructure and materials.
When it comes to wind, in 2021 China built more offshore wind turbines than all other countries combined over the past five years, and the country is also the leading producer and processor of the rare earth minerals essential for the magnets that power turbine generators.
In its full report on solar panel manufacturing, the IEA emphasized the importance of distributing global solar panel manufacturing capacity. Recent unexpected manufacturing halts in China have resulted in the price of polysilicon rising to 10-year highs, revealing the world’s dependence on China for the supply of key materials.
As the world builds out its solar and wind energy capacity, will it manage to avoid repeating Europe’s mistakes of energy import overdependence when it comes to the materials and manufacturing of renewable energy infrastructure?


Energy
Charted: 4 Reasons Why Lithium Could Be the Next Gold Rush
Visual Capitalist has partnered with EnergyX to show why drops in prices and growing demand may make now the right time to invest in lithium.


4 Reasons Why You Should Invest in Lithium
Lithium’s importance in powering EVs makes it a linchpin of the clean energy transition and one of the world’s most precious minerals.
In this graphic, Visual Capitalist partnered with EnergyX to explore why now may be the time to invest in lithium.
1. Lithium Prices Have Dropped
One of the most critical aspects of evaluating an investment is ensuring that the asset’s value is higher than its price would indicate. Lithium is integral to powering EVs, and, prices have fallen fast over the last year:
| Date | LiOH·H₂O* | Li₂CO₃** |
|---|---|---|
| Feb 2023 | $76 | $71 |
| March 2023 | $71 | $61 |
| Apr 2023 | $43 | $33 |
| May 2023 | $43 | $33 |
| June 2023 | $47 | $45 |
| July 2023 | $44 | $40 |
| Aug 2023 | $35 | $35 |
| Sept 2023 | $28 | $27 |
| Oct 2023 | $24 | $23 |
| Nov 2023 | $21 | $21 |
| Dec 2023 | $17 | $16 |
| Jan 2024 | $14 | $15 |
| Feb 2024 | $13 | $14 |
Note: Monthly spot prices were taken as close to the 14th of each month as possible.
*Lithium hydroxide monohydrate MB-LI-0033
**Lithium carbonate MB-LI-0029
2. Lithium-Ion Battery Prices Are Also Falling
The drop in lithium prices is just one reason to invest in the metal. Increasing economies of scale, coupled with low commodity prices, have caused the cost of lithium-ion batteries to drop significantly as well.
In fact, BNEF reports that between 2013 and 2023, the price of a Li-ion battery dropped by 82%.
| Year | Price per KWh |
|---|---|
| 2023 | $139 |
| 2022 | $161 |
| 2021 | $150 |
| 2020 | $160 |
| 2019 | $183 |
| 2018 | $211 |
| 2017 | $258 |
| 2016 | $345 |
| 2015 | $448 |
| 2014 | $692 |
| 2013 | $780 |

3. EV Adoption is Sustainable
One of the best reasons to invest in lithium is that EVs, one of the main drivers behind the demand for lithium, have reached a price point similar to that of traditional vehicle.
According to the Kelly Blue Book, Tesla’s average transaction price dropped by 25% between 2022 and 2023, bringing it in line with many other major manufacturers and showing that EVs are a realistic transport option from a consumer price perspective.
| Manufacturer | September 2022 | September 2023 |
|---|---|---|
| BMW | $69,000 | $72,000 |
| Ford | $54,000 | $56,000 |
| Volkswagon | $54,000 | $56,000 |
| General Motors | $52,000 | $53,000 |
| Tesla | $68,000 | $51,000 |
4. Electricity Demand in Transport is Growing
As EVs become an accessible transport option, there’s an investment opportunity in lithium. But possibly the best reason to invest in lithium is that the IEA reports global demand for the electricity in transport could grow dramatically by 2030:
| Transport Type | 2022 | 2025 | 2030 |
|---|---|---|---|
| Buses 🚌 | 23,000 GWh | 50,000 GWh | 130,000 GWh |
| Cars 🚙 | 65,000 GWh | 200,000 GWh | 570,000 GWh |
| Trucks 🛻 | 4,000 GWh | 15,000 GWh | 94,000 GWh |
| Vans 🚐 | 6,000 GWh | 16,000 GWh | 72,000 GWh |
The Lithium Investment Opportunity
Lithium presents a potentially classic investment opportunity. Lithium and battery prices have dropped significantly, and recently, EVs have reached a price point similar to other vehicles. By 2030, the demand for clean energy, especially in transport, will grow dramatically.
With prices dropping and demand skyrocketing, now is the time to invest in lithium.
EnergyX is poised to exploit lithium demand with cutting-edge lithium extraction technology capable of extracting 300% more lithium than current processes.

-

 Lithium3 days ago
Ranked: The Top 10 EV Battery Manufacturers in 2023
Asia dominates this ranking of the world’s largest EV battery manufacturers in 2023.
-

 Energy1 week ago
The World’s Biggest Nuclear Energy Producers
China has grown its nuclear capacity over the last decade, now ranking second on the list of top nuclear energy producers.
-

 Energy4 weeks ago
The World’s Biggest Oil Producers in 2023
Just three countries accounted for 40% of global oil production last year.
-

 Energy1 month ago
How Much Does the U.S. Depend on Russian Uranium?
Currently, Russia is the largest foreign supplier of nuclear power fuel to the U.S.
-

 Uranium2 months ago
Charted: Global Uranium Reserves, by Country
We visualize the distribution of the world’s uranium reserves by country, with 3 countries accounting for more than half of total reserves.
-

 Energy3 months ago
Visualizing the Rise of the U.S. as Top Crude Oil Producer
Over the last decade, the United States has established itself as the world’s top producer of crude oil, surpassing Saudi Arabia and Russia.


-

 Mining1 week ago
Gold vs. S&P 500: Which Has Grown More Over Five Years?
-

 Markets2 weeks ago
Ranked: The Most Valuable Housing Markets in America
-

 Money2 weeks ago
Which States Have the Highest Minimum Wage in America?
-

 AI2 weeks ago
Ranked: Semiconductor Companies by Industry Revenue Share
-

 Markets2 weeks ago
Ranked: The World’s Top Flight Routes, by Revenue
-

 Countries2 weeks ago
Population Projections: The World’s 6 Largest Countries in 2075
-

 Markets2 weeks ago
The Top 10 States by Real GDP Growth in 2023
-

 Demographics2 weeks ago
The Smallest Gender Wage Gaps in OECD Countries