Energy
Visualized: How Much Do EV Batteries Cost?
![]() Subscribe to the Elements free mailing list for more like this
Subscribe to the Elements free mailing list for more like this
How Much Do EV Batteries Cost?
This was originally posted on Elements. Sign up to the free mailing list to get beautiful visualizations on natural resource megatrends in your email every other week.
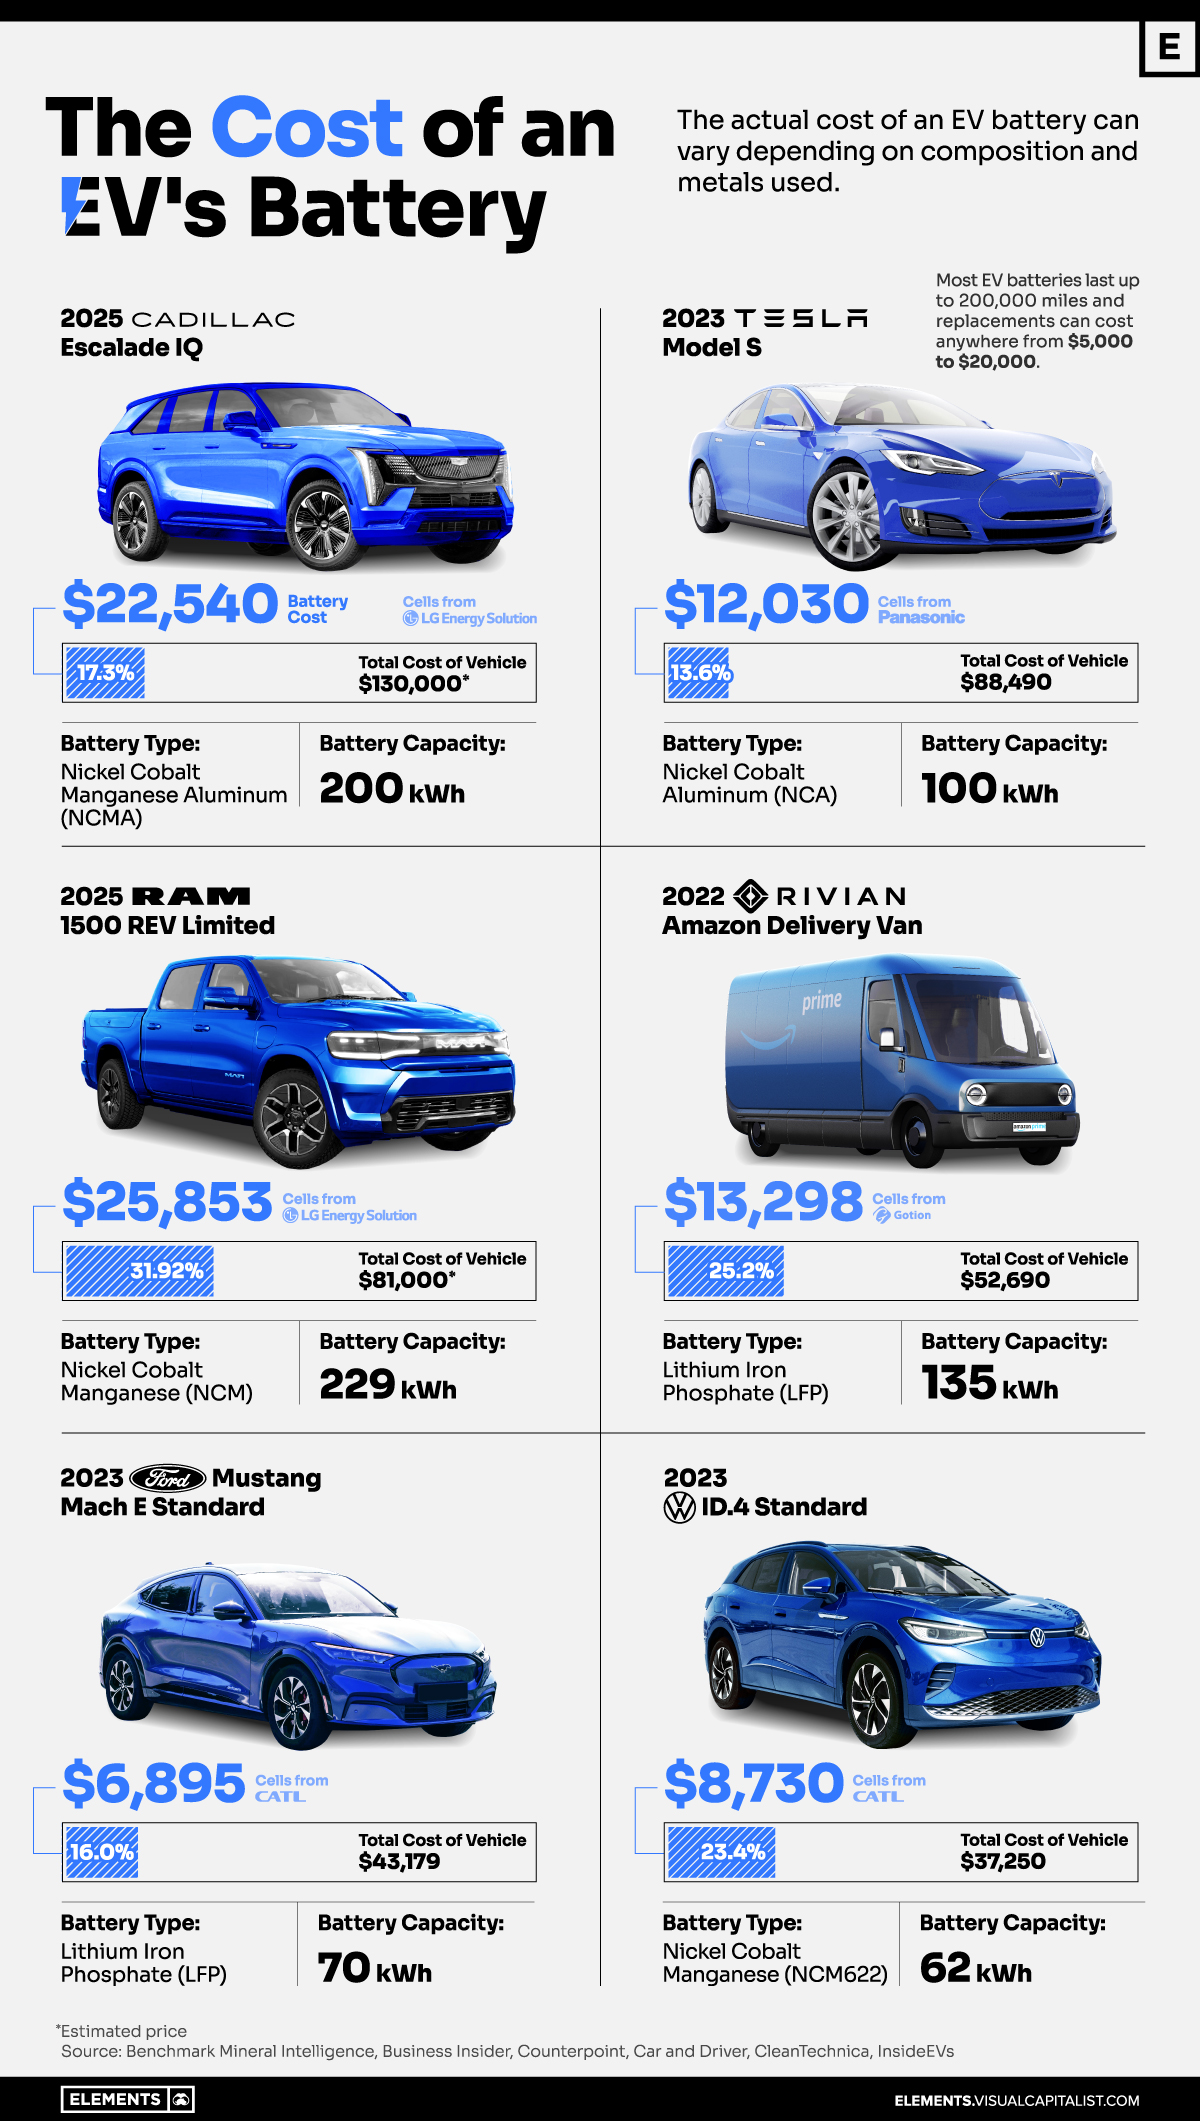
The cost of an electric vehicle (EV) battery pack can vary depending on composition and chemistry.
In this graphic, we use data from Benchmark Minerals Intelligence to showcase the different costs of battery cells on popular electric vehicles.
Size Matters
Some EV owners are taken by surprise when they discover the cost of replacing their batteries.
Depending on the brand and model of the vehicle, the cost of a new lithium-ion battery pack might be as high as $25,000:
| Vehicle | Battery Type | Battery Capacity | Battery Cost | Total Cost of EV |
|---|---|---|---|---|
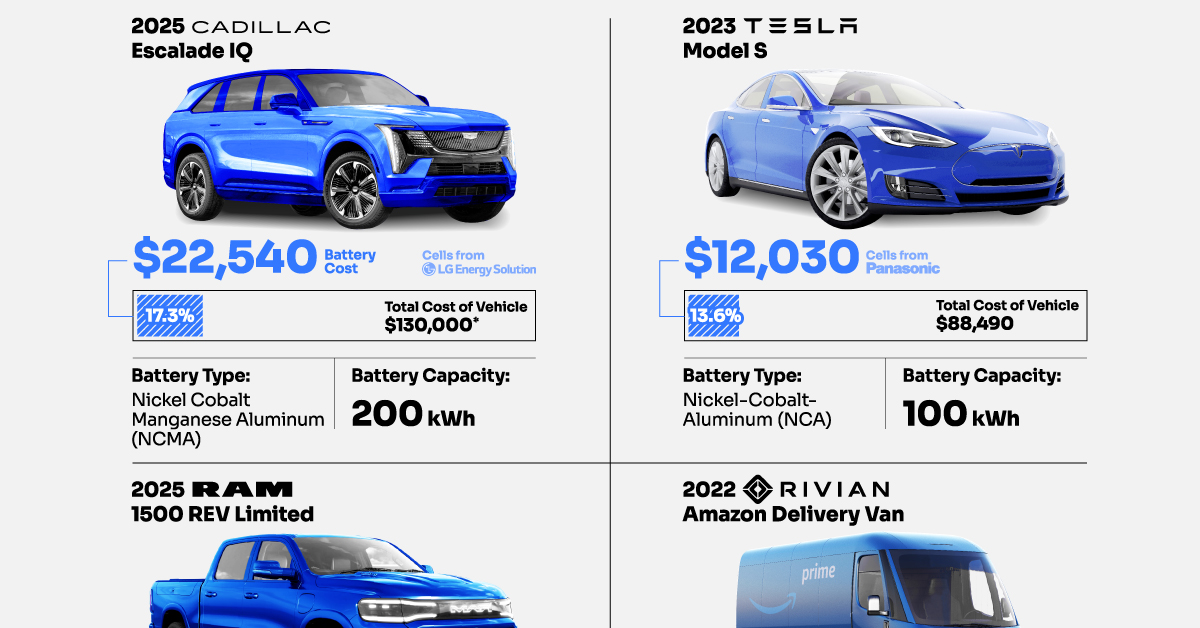
| 2025 Cadillac Escalade IQ | Nickel Cobalt Manganese Aluminum (NCMA) | 200 kWh | $22,540 | $130,000 |
| 2023 Tesla Model S | Nickel Cobalt Aluminum (NCA) | 100 kWh | $12,030 | $88,490 |
| 2025 RAM 1500 REV | Nickel Cobalt Manganese (NCM) | 229 kWh | $25,853 | $81,000 |
| 2022 Rivian Delivery Van | Lithium Iron phosphate (LFP) | 135 kWh | $13,298 | $52,690 |
| 2023 Ford Mustang | Lithium Iron Phosphate (LFP) | 70 kWh | $6,895 | $43,179 |
| 2023 VW ID.4 | Nickel Cobalt Manganese (NCM622) | 62 kWh | $8,730 | $37,250 |
The price of an EV battery pack can be shaped by various factors such as raw material costs, production expenses, packaging complexities, and supply chain stability. One of the main factors is chemical composition.
Graphite is the standard material used for the anodes in most lithium-ion batteries.
However, it is the mineral composition of the cathode that usually changes. It includes lithium and other minerals such as nickel, manganese, cobalt, or iron. This specific composition is pivotal in establishing the battery’s capacity, power, safety, lifespan, cost, and overall performance.
Lithium nickel cobalt aluminum oxide (NCA) battery cells have an average price of $120.3 per kilowatt-hour (kWh), while lithium nickel cobalt manganese oxide (NCM) has a slightly lower price point at $112.7 per kWh. Both contain significant nickel proportions, increasing the battery’s energy density and allowing for longer range.
At a lower cost are lithium iron phosphate (LFP) batteries, which are cheaper to make than cobalt and nickel-based variants. LFP battery cells have an average price of $98.5 per kWh. However, they offer less specific energy and are more suitable for standard- or short-range EVs.
Which Battery Dominates the EV Market?
In 2021, the battery market was dominated by NCM batteries, with 58% of the market share, followed by LFP and NCA, holding 21% each.
Looking ahead to 2026, the market share of LFP is predicted to nearly double, reaching 38%.
NCM is anticipated to constitute 45% of the market and NCA is expected to decline to 7%.


Who’s Building the Most Solar Energy?
This was originally posted on our Voronoi app. Download the app for free on iOS or Android and discover incredible data-driven charts from a variety of trusted sources.
In 2023, solar energy accounted for three-quarters of renewable capacity additions worldwide. Most of this growth occurred in Asia, the EU, and the U.S., continuing a trend observed over the past decade.
In this graphic, we illustrate the rise in installed solar photovoltaic (PV) capacity in China, the EU, and the U.S. between 2010 and 2022, measured in gigawatts (GW). Bruegel compiled the data..
Chinese Dominance
As of 2022, China’s total installed capacity stands at 393 GW, nearly double that of the EU’s 205 GW and surpassing the USA’s total of 113 GW by more than threefold in absolute terms.
| Installed solar capacity (GW) | China | EU27 | U.S. |
|---|---|---|---|
| 2022 | 393.0 | 205.5 | 113.0 |
| 2021 | 307.0 | 162.7 | 95.4 |
| 2020 | 254.0 | 136.9 | 76.4 |
| 2019 | 205.0 | 120.1 | 61.6 |
| 2018 | 175.3 | 104.0 | 52.0 |
| 2017 | 130.8 | 96.2 | 43.8 |
| 2016 | 77.8 | 91.5 | 35.4 |
| 2015 | 43.6 | 87.7 | 24.2 |
| 2014 | 28.4 | 83.6 | 18.1 |
| 2013 | 17.8 | 79.7 | 13.3 |
| 2012 | 6.7 | 71.1 | 8.6 |
| 2011 | 3.1 | 53.3 | 5.6 |
| 2010 | 1.0 | 30.6 | 3.4 |
Since 2017, China has shown a compound annual growth rate (CAGR) of approximately 25% in installed PV capacity, while the USA has seen a CAGR of 21%, and the EU of 16%.
Additionally, China dominates the production of solar power components, currently controlling around 80% of the world’s solar panel supply chain.
In 2022, China’s solar industry employed 2.76 million individuals, with manufacturing roles representing approximately 1.8 million and the remaining 918,000 jobs in construction, installation, and operations and maintenance.
The EU industry employed 648,000 individuals, while the U.S. reached 264,000 jobs.
According to the IEA, China accounts for almost 60% of new renewable capacity expected to become operational globally by 2028.
Despite the phasing out of national subsidies in 2020 and 2021, deployment of solar PV in China is accelerating. The country is expected to reach its national 2030 target for wind and solar PV installations in 2024, six years ahead of schedule.

-

 Markets5 days ago
Mapped: The Most Valuable Company in Each Southeast Asian Country
-

 Markets2 weeks ago
The Top Private Equity Firms by Country
-

 Jobs2 weeks ago
The Best U.S. Companies to Work for According to LinkedIn
-

 Economy2 weeks ago
Ranked: The Top 20 Countries in Debt to China
-

 Politics1 week ago
Charted: Trust in Government Institutions by G7 Countries
-

 Energy1 week ago
Mapped: The Age of Energy Projects in Interconnection Queues, by State
-

 Mining1 week ago
Visualizing Global Gold Production in 2023
-

 Markets1 week ago
Visualized: Interest Rate Forecasts for Advanced Economies