Technology
50 Years of Video Game Industry Revenues, by Platform
Click to view this graphic in a higher-resolution.
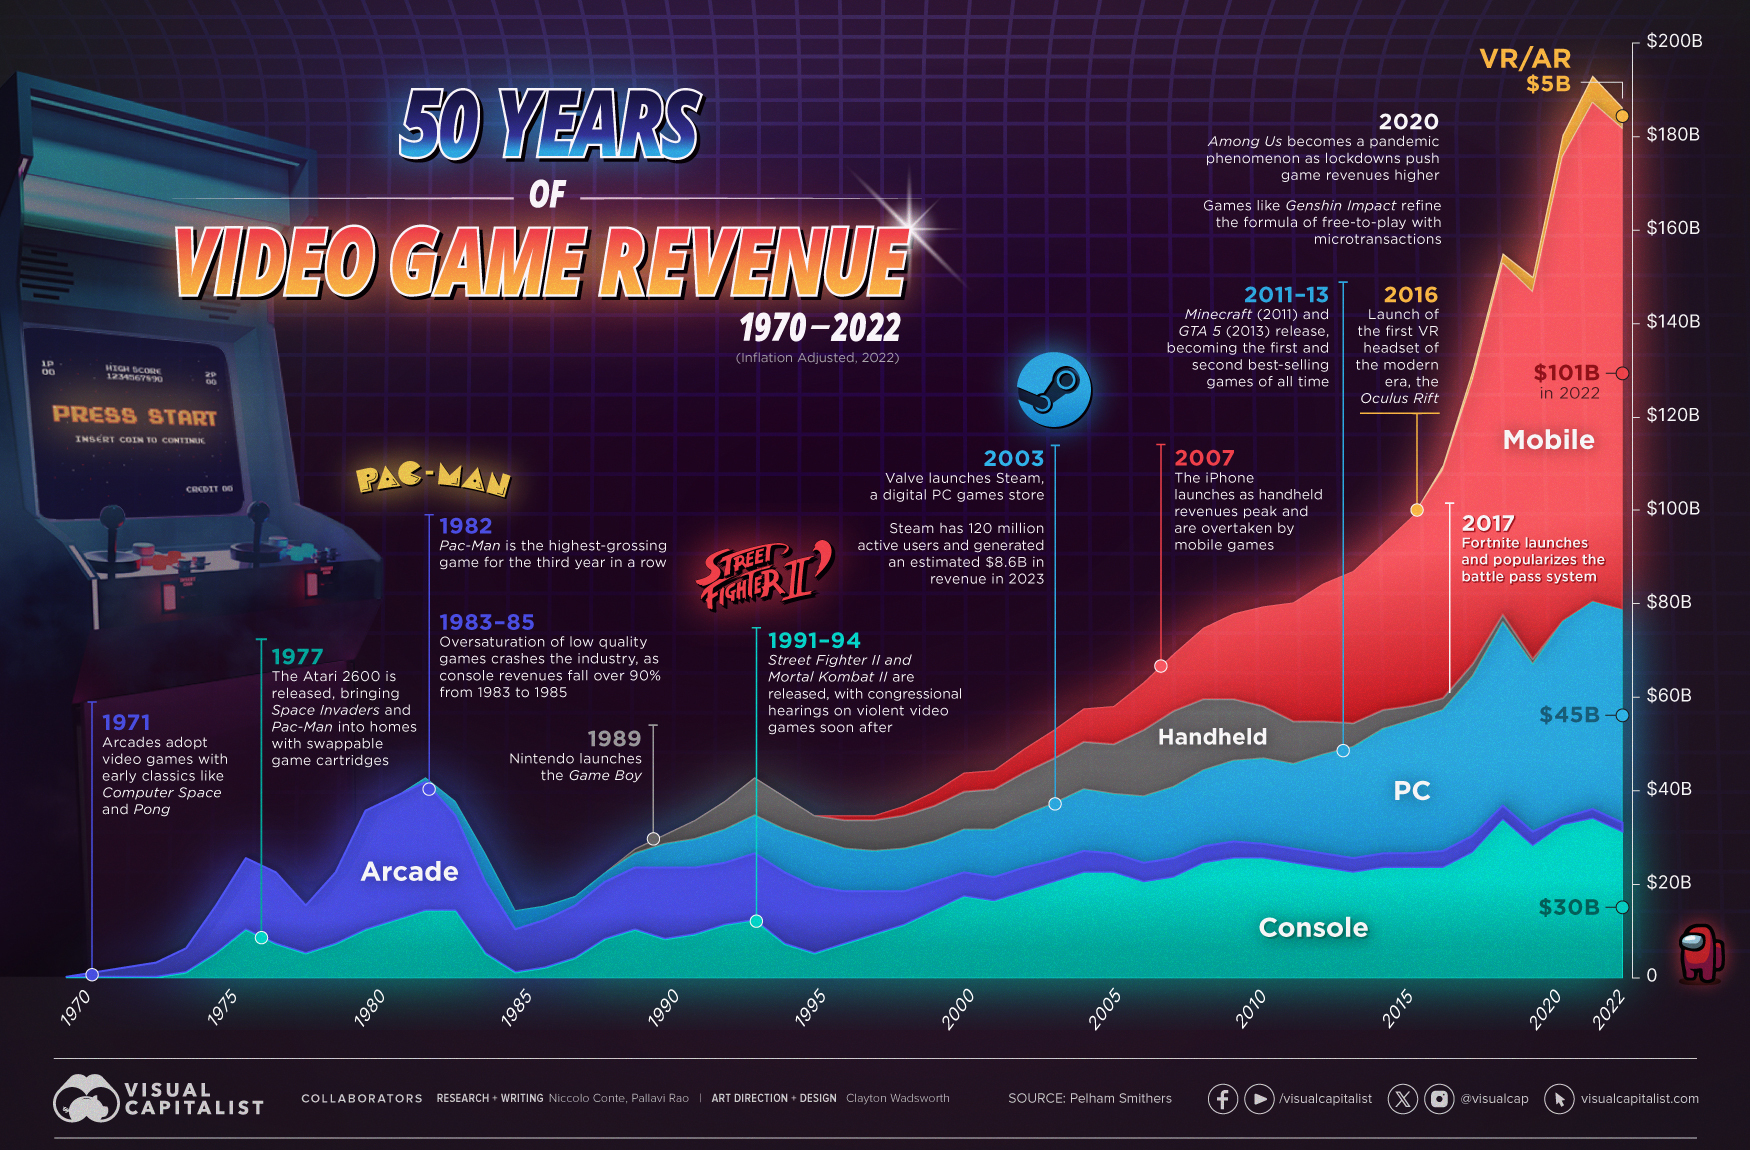
50 Years of Video Game Industry Revenues, by Platform
Video killed the radio star.
And the video game industry’s explosive growth over the last five decades has killed any skepticism of its strength and staying power in the larger media and entertainment space.
We visualize the video game industry’s inflation-adjusted revenues every year, from its humble beginnings in 1970 to the media juggernaut it is now, worth more than $180 billion of revenue in 2022. All data presented in the chart and in this article was provided by UK-based market intelligence firm Pelham Smithers.
| Year | Total Game Industry Revenue (USD, Billions) | % Increase (YoY) |
|---|---|---|
| 1970 | $0 | N/A |
| 1971 | $1 | N/A |
| 1972 | $2 | 100% |
| 1973 | $3 | 50% |
| 1974 | $6 | 100% |
| 1975 | $15 | 150% |
| 1976 | $25 | 67% |
| 1977 | $22 | -12% |
| 1978 | $15 | -32% |
| 1979 | $22 | 47% |
| 1980 | $35 | 59% |
| 1981 | $38 | 9% |
| 1982 | $42 | 11% |
| 1983 | $37 | -12% |
| 1984 | $26 | -30% |
| 1985 | $14 | -46% |
| 1986 | $15 | 7% |
| 1987 | $17 | 13% |
| 1988 | $22 | 29% |
| 1989 | $27 | 23% |
| 1990 | $30 | 11% |
| 1991 | $33 | 10% |
| 1992 | $37 | 12% |
| 1993 | $42 | 14% |
| 1994 | $38 | -10% |
| 1995 | $34 | -11% |
| 1996 | $34 | 0% |
| 1997 | $34 | 0% |
| 1998 | $36 | 6% |
| 1999 | $39 | 8% |
| 2000 | $43 | 10% |
| 2001 | $44 | 1% |
| 2002 | $48 | 10% |
| 2003 | $52 | 8% |
| 2004 | $57 | 9% |
| 2005 | $57 | 1% |
| 2006 | $62 | 9% |
| 2007 | $68 | 10% |
| 2008 | $74 | 8% |
| 2009 | $77 | 4% |
| 2010 | $78 | 2% |
| 2011 | $79 | 1% |
| 2012 | $83 | 5% |
| 2013 | $85 | 3% |
| 2014 | $91 | 7% |
| 2015 | $97 | 6% |
| 2016 | $108 | 11% |
| 2017 | $128 | 19% |
| 2018 | $152 | 19% |
| 2019 | $147 | -3% |
| 2020 | $177 | 20% |
| 2021 | $190 | 7% |
| 2022 | $183 | -4% |
Note: Numbers are rounded to the nearest billion.
From an industry that was nearly wiped out by a market crash, to the highest-earning media sector today, video games have had a tumultuous journey.
As medium has evolved, so too have the consumer preferences for different gaming platforms. Which formats led the overall industry’s revenue growth through the years?
Arcades, Home Consoles, Handheld Gaming
The history of mass-market consumer-oriented video games starts with Atari.
The company that released Computer Space (1971) and Pong (1972) on coin-operated arcade machines took the market by storm, spawning a series of competitors, earning an estimated $35-40 per day, and selling nearly 8,000 units in two years.
For an industry that barely existed until a couple years prior, those numbers spurred the inception of video games as a legitimate (and profitable) form of entertainment.
| Year | Arcade Revenues (USD, Billions) | Console Revenues (USD, Billions) | Handheld Revenues (USD, Billions) |
|---|---|---|---|
| 1970 | $0 | N/A | N/A |
| 1971 | $1 | N/A | N/A |
| 1972 | $2 | N/A | N/A |
| 1973 | $3 | N/A | N/A |
| 1974 | $5 | $1 | N/A |
| 1975 | $10 | $5 | N/A |
| 1976 | $15 | $10 | N/A |
| 1977 | $15 | $7 | N/A |
| 1978 | $10 | $5 | N/A |
| 1979 | $15 | $7 | N/A |
| 1980 | $25 | $10 | N/A |
| 1981 | $26 | $12 | N/A |
| 1982 | $27 | $14 | N/A |
| 1983 | $20 | $14 | N/A |
| 1984 | $15 | $5 | N/A |
| 1985 | $9 | $1 | N/A |
| 1986 | $10 | $2 | N/A |
| 1987 | $11 | $4 | N/A |
| 1988 | $12 | $8 | N/A |
| 1989 | $13 | $10 | $1 |
| 1990 | $15 | $8 | $2 |
| 1991 | $14 | $9 | $4 |
| 1992 | $13 | $11 | $6 |
| 1993 | $14 | $12 | $8 |
| 1994 | $15 | $7 | $7 |
| 1995 | $14 | $5 | $5 |
| 1996 | $11 | $7 | $6 |
| 1997 | $9 | $9 | $7 |
| 1998 | $7 | $11 | $7 |
| 1999 | $6 | $14 | $8 |
| 2000 | $5 | $17 | $8 |
| 2001 | $5 | $16 | $9 |
| 2002 | $5 | $18 | $9 |
| 2003 | $5 | $20 | $10 |
| 2004 | $5 | $22 | $10 |
| 2005 | $4 | $22 | $11 |
| 2006 | $4 | $20 | $14 |
| 2007 | $4 | $21 | $16 |
| 2008 | $4 | $24 | $15 |
| 2009 | $4 | $25 | $13 |
| 2010 | $3 | $25 | $11 |
| 2011 | $3 | $24 | $9 |
| 2012 | $3 | $23 | $7 |
| 2013 | $3 | $22 | $5 |
| 2014 | $3 | $23 | $4 |
| 2015 | $3 | $23 | $3 |
| 2016 | $4 | $23 | $3 |
| 2017 | $4 | $26 | $3 |
| 2018 | $3 | $33 | $2 |
| 2019 | $3 | $28 | $1 |
| 2020 | $2 | $32 | $0 |
| 2021 | $2 | $33 | $0 |
| 2022 | $2 | $30 | $0 |
| Share of Total Industry Revenue in 2022 | 1.1% | 16.6% | 0.0% |
Note: Numbers are rounded to the nearest billion.
Within just seven years, thanks to the proliferation of arcade games, the video game industry generated more revenue than the American box office and music industry put together.
Then, in the 1980s, a once little-known playing card company in Japan released one of the best-selling video game franchises ever, Super Mario Bros on their home console the Nintendo Entertainment System (NES).
A few years later, at the cusp of the ’90s, Nintendo released the iconic Game Boy on which enthusiasts could play Tetris—a popular arcade game—from the comfort of their bed, cementing video games’ place in consumers’ homes.
PC Gaming, Mobile Gaming, and Virtual Reality
By the ’90s, another technological boom was taking place: the rise of personal computing.
Naturally, companies developed video games (like Doom, Prince of Persia, Dangerous Dave) for this new platform, taking advantage of increased computing power, bigger screens, and more flexibility in programming.
While home consoles still accounted for the majority share of the industry’s revenues, handheld devices and PC gaming split the difference as arcade revenues began to drop rapidly.
| Year | PC Revenues (USD, Billions) | Mobile Revenues (USD, Billions) | VR/AR Revenues (USD, Billions) |
|---|---|---|---|
| 1982 | $1 | N/A | N/A |
| 1983 | $3 | N/A | N/A |
| 1984 | $6 | N/A | N/A |
| 1985 | $4 | N/A | N/A |
| 1986 | $3 | N/A | N/A |
| 1987 | $2 | N/A | N/A |
| 1988 | $2 | N/A | N/A |
| 1989 | $3 | N/A | N/A |
| 1990 | $5 | N/A | N/A |
| 1991 | $6 | N/A | N/A |
| 1992 | $7 | N/A | N/A |
| 1993 | $8 | N/A | N/A |
| 1994 | $9 | N/A | N/A |
| 1995 | $10 | N/A | N/A |
| 1996 | $9 | $1 | N/A |
| 1997 | $9 | $1 | N/A |
| 1998 | $9 | $2 | N/A |
| 1999 | $9 | $3 | N/A |
| 2000 | $9 | $4 | N/A |
| 2001 | $10 | $4 | N/A |
| 2002 | $11 | $5 | N/A |
| 2003 | $12 | $6 | N/A |
| 2004 | $13 | $7 | N/A |
| 2005 | $13 | $8 | N/A |
| 2006 | $14 | $10 | N/A |
| 2007 | $15 | $12 | N/A |
| 2008 | $16 | $15 | N/A |
| 2009 | $17 | $18 | N/A |
| 2010 | $18 | $21 | N/A |
| 2011 | $18 | $25 | N/A |
| 2012 | $21 | $29 | N/A |
| 2013 | $23 | $32 | N/A |
| 2014 | $26 | $35 | N/A |
| 2015 | $28 | $40 | N/A |
| 2016 | $30 | $48 | $1 |
| 2017 | $34 | $60 | $2 |
| 2018 | $39 | $74 | $2 |
| 2019 | $35 | $77 | $3 |
| 2020 | $41 | $98 | $5 |
| 2021 | $44 | $105 | $6 |
| 2022 | $45 | $101 | $5 |
| Share of Total Industry Revenue in 2022 | 24.5% | 55.3% | 2.5% |
Note: Numbers are rounded to the nearest billion.
However, handheld gaming revenues peaked in 2007, the year the iPhone launched, and have steadily declined since then as smartphone adoption has grown.
With smartphones came the mobile gaming juggernaut, which has made up more than half of the gaming industry’s revenues since 2019.
In the last few years however, the development of augmented and virtual reality’s more immersive, and sensory-heavy experiences have created yet another platform for video games, and yet another avenue for growth.


Technology
Countries With the Highest Rates of Crypto Ownership
While the U.S. is a major market for cryptocurrencies, two countries surpass it in terms of their rates of crypto ownership.


Countries With the Highest Rates of Crypto Ownership
This was originally posted on our Voronoi app. Download the app for free on iOS or Android and discover incredible data-driven charts from a variety of trusted sources.
This graphic ranks the top 10 countries by their rate of cryptocurrency ownership, which is the percentage of the population that owns crypto. These figures come from crypto payment gateway, Triple-A, and are as of 2023.
Data and Highlights
The table below lists the rates of crypto ownership in the top 10 countries, as well as the number of people this amounts to.
| Country | % of Population Who Own Crypto | # of Crypto Owners |
|---|---|---|
| 🇦🇪 United Arab Emirates | 30.4 | 3M |
| 🇻🇳 Vietnam | 21.2 | 21M |
| 🇺🇸 U.S. | 15.6 | 53M |
| 🇮🇷 Iran | 13.5 | 12M |
| 🇵🇭 Philippines | 13.4 | 16M |
| 🇧🇷 Brazil | 12 | 26M |
| 🇸🇦 Saudi Arabia | 11.4 | 4M |
| 🇸🇬 Singapore | 11.1 | 665K |
| 🇺🇦 Ukraine | 10.6 | 4M |
| 🇻🇪 Venezuela | 10.3 | 3M |
Note that if we were to rank countries based on their actual number of crypto owners, India would rank first at 93 million people, China would rank second at 59 million people, and the U.S. would rank third at 52 million people.
The UAE Takes the Top Spot
The United Arab Emirates (UAE) boasts the highest rates of crypto ownership globally. The country’s government is considered to be very crypto friendly, as described in Henley & Partners’ Crypto Wealth Report 2023:
In the UAE, the Financial Services Regulatory Authority (FSRA-ADGM) was the first to provide rules and regulations regarding cryptocurrency purchasing and selling. The Emirates are generally very open to new technologies and have proposed zero taxes for crypto owners and businesses.
Vietnam leads Southeast Asia
According to the Crypto Council for Innovation, cryptocurrency holdings in Vietnam are also untaxed, making them an attractive asset.
Another reason for Vietnam’s high rates of ownership could be its large unbanked population (people without access to financial services). Cryptocurrencies may provide an alternative means of accessing these services without relying on traditional banks.
Learn More About Crypto From Visual Capitalist
If you enjoyed this post, be sure to check out The World’s Largest Corporate Holders of Bitcoin, which ranks the top 12 publicly traded companies by their Bitcoin holdings.

-

 Politics5 days ago
Charted: What Southeast Asia Thinks About China & the U.S.
-

 United States2 weeks ago
Visualizing the Most Common Pets in the U.S.
-

 Culture2 weeks ago
The World’s Top Media Franchises by All-Time Revenue
-

 voronoi2 weeks ago
Best Visualizations of April on the Voronoi App
-

 Wealth2 weeks ago
Charted: Which Country Has the Most Billionaires in 2024?
-

 Business1 week ago
The Top Private Equity Firms by Country
-

 Markets1 week ago
The Best U.S. Companies to Work for According to LinkedIn
-

 Economy1 week ago
Ranked: The Top 20 Countries in Debt to China