Technology
Ranked: The Best-Selling Video Game Consoles of All Time
Article/Editing:
Ranked: The Best-Selling Video Game Consoles of All Time
In 1972, the first-ever commercially available home video game console hit the market—the Magnavox Odyssey. Players of the Odyssey had a choice between two built-in games that were stored directly in the device, and would use a joystick and dials as a controller.
Video game consoles have come a long way since then, and the console market has grown into a multi-billion dollar industry that’s expected to reach $72.67 billion in value by the end of 2022.
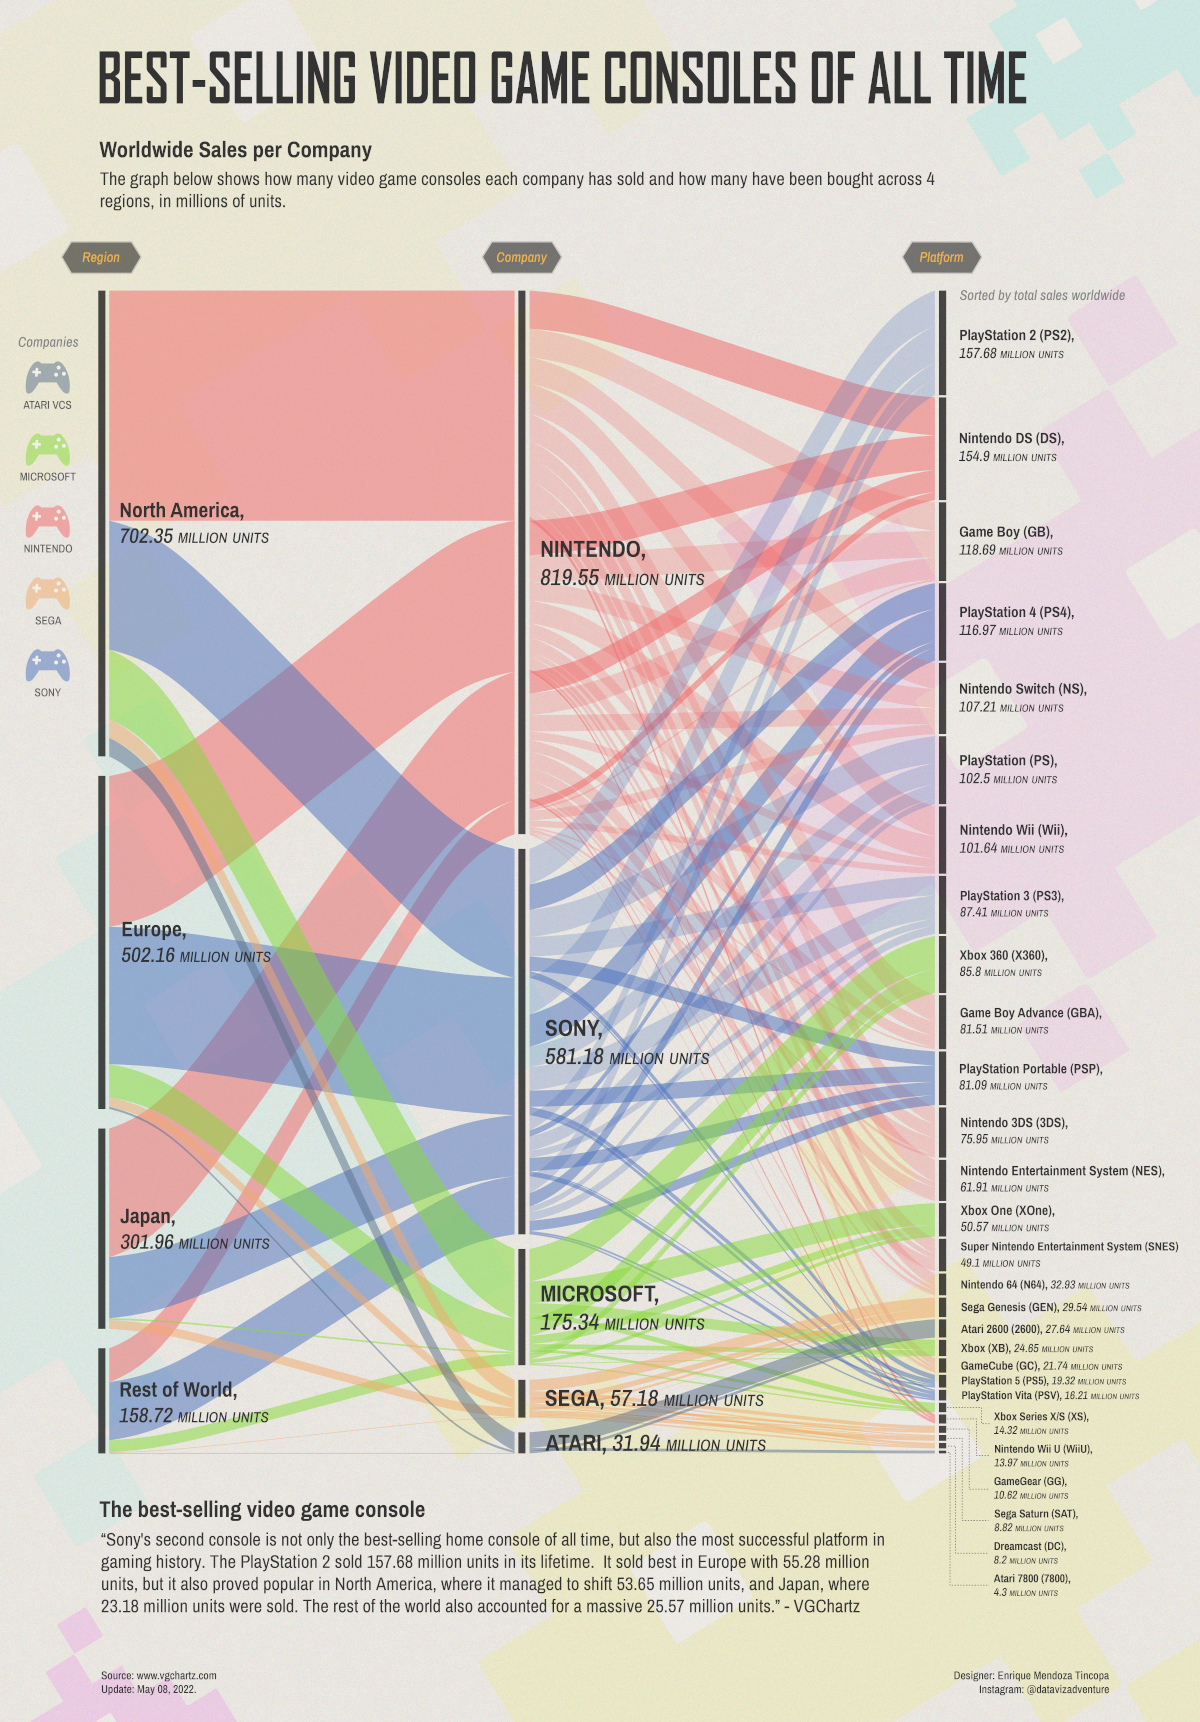
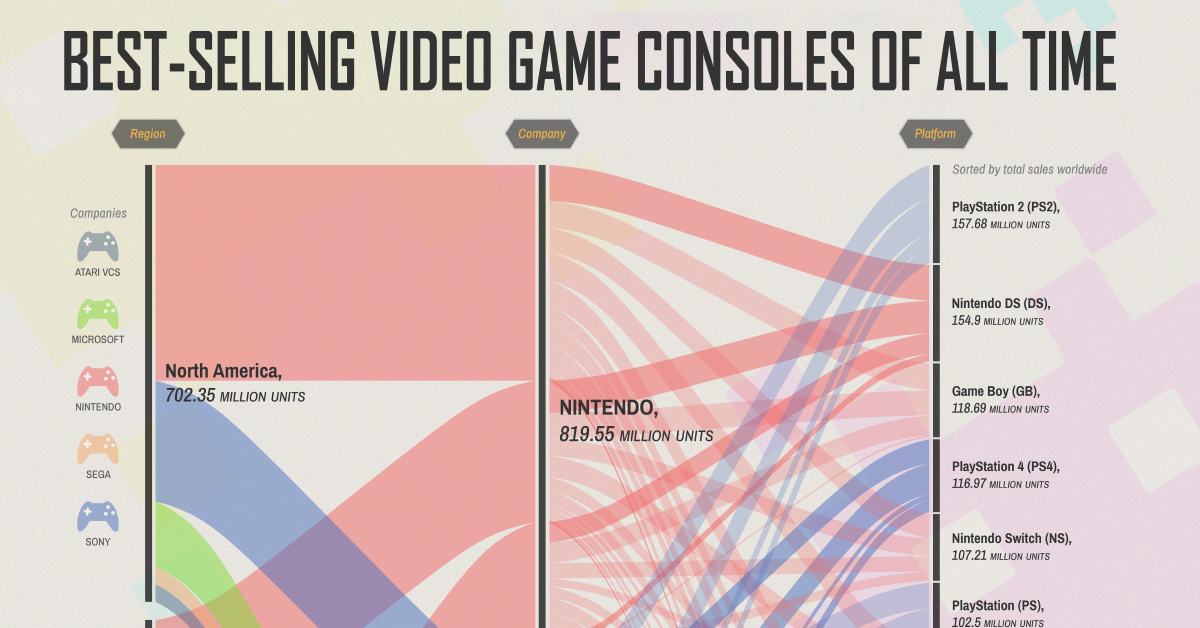
This graphic by Enrique Mendoza uses data from VGChartz to show the market leaders in the industry, by highlighting the top-selling video consoles of all time, as of May 8, 2022.
Nine Generations of Video Game Consoles
Before diving into the top-selling consoles, it’s worth taking a step back to touch on the evolution of home consoles to show how they’ve changed over the years.
We dug into the literature on the history of video game consoles, and found that most articles and blog posts on the topic cite nine different generations of devices.
Here’s a breakdown of each generation, and some of their most noteworthy systems:
1972: Gen One, Where it Began
Consoles in the first generation had pre-built games that were stored directly on the device. They include the Magnavox Odyssey and Atari’s Pong.
1976: Gen Two Emerges
In this generation, games were sold separately, rather than programmed into the device. Consoles of this gen include the Fairchild Channel F and the Atari 2600.
1983: Gen Three, the “8-bit Generation”
This era’s consoles typically had 8-bit processes which allowed for more advanced graphics for the time. A few notable consoles during this gen were the Sega SG-1000 and the Nintendo Famicom, released outside Japan as the Nintendo Entertainment System (NES).
1987: Gen Four Elevates Handheld Gaming
Home consoles were released with 16-bit systems, meaning that audio and graphics improved even more in this era. But an arguably bigger moment for this gen was the emergence of the Nintendo Game Boy.
1993: The 3D Start of Gen Five
This generation saw the move away from pixels and towards 3D polygons. Some consoles like the Sony PlayStation started using CD-ROMs instead of cartridges, which stored more data at a cheaper cost and changed the industry.
1998: Gen Six and the Internet
At the start of this generation, the three major players in the console space were Sony, Sega, and Nintendo. By the end, Sega would be replaced with Microsoft as it launched the Xbox and helped popularize online console gaming.
2005: HD Graphics and Motion Controls of Gen Seven
On one side of the market, Microsoft and Sony were competing with high-definition graphics, faster processers, and different forms (Blu-rays or DVDs). But Nintendo’s motion-sensing Nintendo Wii arguably defined this generation, and the handheld Nintendo DS swept the market as well.
2012: Gen Eight’s Modern Consoles
Consoles of this era started having increased connectivity and processing power, with full HD an expectation. It was also an extremely long generation, starting with Nintendo’s unsuccessful Wii U and ending with the ultra-successful Nintendo Switch, widely considered the first hybrid console with three different ways to play: TV mode, handheld mode, or tabletop mode.
2020: Gen Nine and Beyond
So far, this generation has brought upgraded graphics (up to 8K resolution), larger games, and game-streaming capabilities. Devices in this gen include the Xbox Series X/S and PlayStation 5, which both use solid state drives to increase speed and performance, while Nintendo has yet to introduce a 9th generation device.
The Best-Selling Game Consoles
The best-selling video game console of all time is Sony’s PlayStation 2 (PS2). More than 157 million systems have been sold around the world since its launch in March 2000.
| Rank | Console | Manufacturer | Global lifetime sales (millions) |
|---|---|---|---|
| 1 | PlayStation 2 (PS2) | Sony | 157.68 |
| 2 | Nintendo DS (DS) | Nintendo | 154.90 |
| 3 | Game Boy (GB) | Nintendo | 118.69 |
| 4 | PlayStation 4 (PS4) | Sony | 116.97 |
| 5 | Nintendo Switch (NS) | Nintendo | 107.21 |
| 6 | PlayStation (PS) | Sony | 102.50 |
| 7 | Nintendo Wii (Wii) | Nintendo | 101.64 |
| 8 | PlayStation 3 (PS3) | Sony | 87.41 |
| 9 | Xbox 360 (X360) | Microsoft | 85.8 |
| 10 | Game Boy Advance (GBA) | Nintendo | 81.51 |
| 11 | PlayStation Portable (PSP) | Sony | 81.09 |
| 12 | Nintendo 3DS (3DS) | Nintendo | 75.95 |
| 13 | Nintendo Entertainment System (NES) | Nintendo | 61.91 |
| 14 | Xbox One (XOne) | Microsoft | 50.57 |
| 15 | Super Nintendo Entertainment System (SNES) | Nintendo | 49.10 |
| 16 | Nintendo 64 (N64) | Nintendo | 32.93 |
| 17 | Sega Genesis (GEN) | Sega | 29.54 |
| 18 | Atari 2600 (2600) | Atari | 27.64 |
| 19 | Xbox (XB) | Microsoft | 24.65 |
| 20 | GameCube (GC) | Nintendo | 21.74 |
| 21 | PlayStation 5 (PS5) | Sony | 19.32 |
| 22 | PlayStation Vita (PSV) | Sony | 16.21 |
| 23 | Xbox Series X/S (XS) | Microsoft | 14.32 |
| 24 | Nintendo Wii U (WiiU) | Nintendo | 13.97 |
| 25 | GameGear (GG) | Sega | 10.62 |
| 26 | Sega Saturn (SAT) | Sega | 8.82 |
| 27 | Dreamcast (DC) | Sega | 8.20 |
| 28 | Atari 7800 (7800) | Atari | 4.30 |
Despite the fact the PS2’s been discontinued since 2013, no other gaming console has managed to top it—in fact, the next closest actively-sold consoles, the PS4 and Nintendo Switch, are each more than 40 million units behind.
One major factor for the PS2’s success was its built-in DVD player. At the time, DVD players were very expensive, and in many places a PS2 was a cheaper and effective alternative. It was also one of the first devices to be “backward compatible,” meaning users could play most of their PS1 games on the PS2. This meant players didn’t have to buy a whole new library of games when they made the switch to a PS2, and Sony could tap into its existing customer base.
But while Sony’s PS2 is the top-selling console on the list, Nintendo has more top-selling consoles on the list—almost half of the consoles on the list are manufactured by Nintendo (11), while only seven are made by Sony.
What Will it Take to Out-Sell the PS2?
As the PS4 has started taking a backseat to the PS5 in sales and promotion, the current most-likely contender for the best-selling console crown is the Nintendo Switch. Early in 2022, it was the fastest console to sell 100 million units.
With lots of hype around the possibilities of AR and VR, it’ll be interesting to see what new features come with the next generation of gaming consoles.
Will future devices ever beat the PS2’s record-breaking sales? Time will tell. But for now, the 22-year-old console continues to hold its well-earned spot at the top.

This article was published as a part of Visual Capitalist's Creator Program, which features data-driven visuals from some of our favorite Creators around the world.


Technology
Visualizing AI Patents by Country
See which countries have been granted the most AI patents each year, from 2012 to 2022.


Visualizing AI Patents by Country
This was originally posted on our Voronoi app. Download the app for free on iOS or Android and discover incredible data-driven charts from a variety of trusted sources.
This infographic shows the number of AI-related patents granted each year from 2010 to 2022 (latest data available). These figures come from the Center for Security and Emerging Technology (CSET), accessed via Stanford University’s 2024 AI Index Report.
From this data, we can see that China first overtook the U.S. in 2013. Since then, the country has seen enormous growth in the number of AI patents granted each year.
| Year | China | EU and UK | U.S. | RoW | Global Total |
|---|---|---|---|---|---|
| 2010 | 307 | 137 | 984 | 571 | 1,999 |
| 2011 | 516 | 129 | 980 | 581 | 2,206 |
| 2012 | 926 | 112 | 950 | 660 | 2,648 |
| 2013 | 1,035 | 91 | 970 | 627 | 2,723 |
| 2014 | 1,278 | 97 | 1,078 | 667 | 3,120 |
| 2015 | 1,721 | 110 | 1,135 | 539 | 3,505 |
| 2016 | 1,621 | 128 | 1,298 | 714 | 3,761 |
| 2017 | 2,428 | 144 | 1,489 | 1,075 | 5,136 |
| 2018 | 4,741 | 155 | 1,674 | 1,574 | 8,144 |
| 2019 | 9,530 | 322 | 3,211 | 2,720 | 15,783 |
| 2020 | 13,071 | 406 | 5,441 | 4,455 | 23,373 |
| 2021 | 21,907 | 623 | 8,219 | 7,519 | 38,268 |
| 2022 | 35,315 | 1,173 | 12,077 | 13,699 | 62,264 |
In 2022, China was granted more patents than every other country combined.
While this suggests that the country is very active in researching the field of artificial intelligence, it doesn’t necessarily mean that China is the farthest in terms of capability.
Key Facts About AI Patents
According to CSET, AI patents relate to mathematical relationships and algorithms, which are considered abstract ideas under patent law. They can also have different meaning, depending on where they are filed.
In the U.S., AI patenting is concentrated amongst large companies including IBM, Microsoft, and Google. On the other hand, AI patenting in China is more distributed across government organizations, universities, and tech firms (e.g. Tencent).
In terms of focus area, China’s patents are typically related to computer vision, a field of AI that enables computers and systems to interpret visual data and inputs. Meanwhile America’s efforts are more evenly distributed across research fields.
Learn More About AI From Visual Capitalist
If you want to see more data visualizations on artificial intelligence, check out this graphic that shows which job departments will be impacted by AI the most.

-

 Mining1 week ago
Gold vs. S&P 500: Which Has Grown More Over Five Years?
-

 Markets2 weeks ago
Ranked: The Most Valuable Housing Markets in America
-

 Money2 weeks ago
Which States Have the Highest Minimum Wage in America?
-

 AI2 weeks ago
Ranked: Semiconductor Companies by Industry Revenue Share
-

 Markets2 weeks ago
Ranked: The World’s Top Flight Routes, by Revenue
-

 Countries2 weeks ago
Population Projections: The World’s 6 Largest Countries in 2075
-

 Markets2 weeks ago
The Top 10 States by Real GDP Growth in 2023
-

 Demographics2 weeks ago
The Smallest Gender Wage Gaps in OECD Countries