Sponsored
Timeline: The Rapid Evolution of Plant-Based Alternatives
The following content is sponsored by Billy Goat Brands (CSE: GOAT) (“GOAT”).
Timeline: The Rapid Evolution of Plant-Based Alternatives
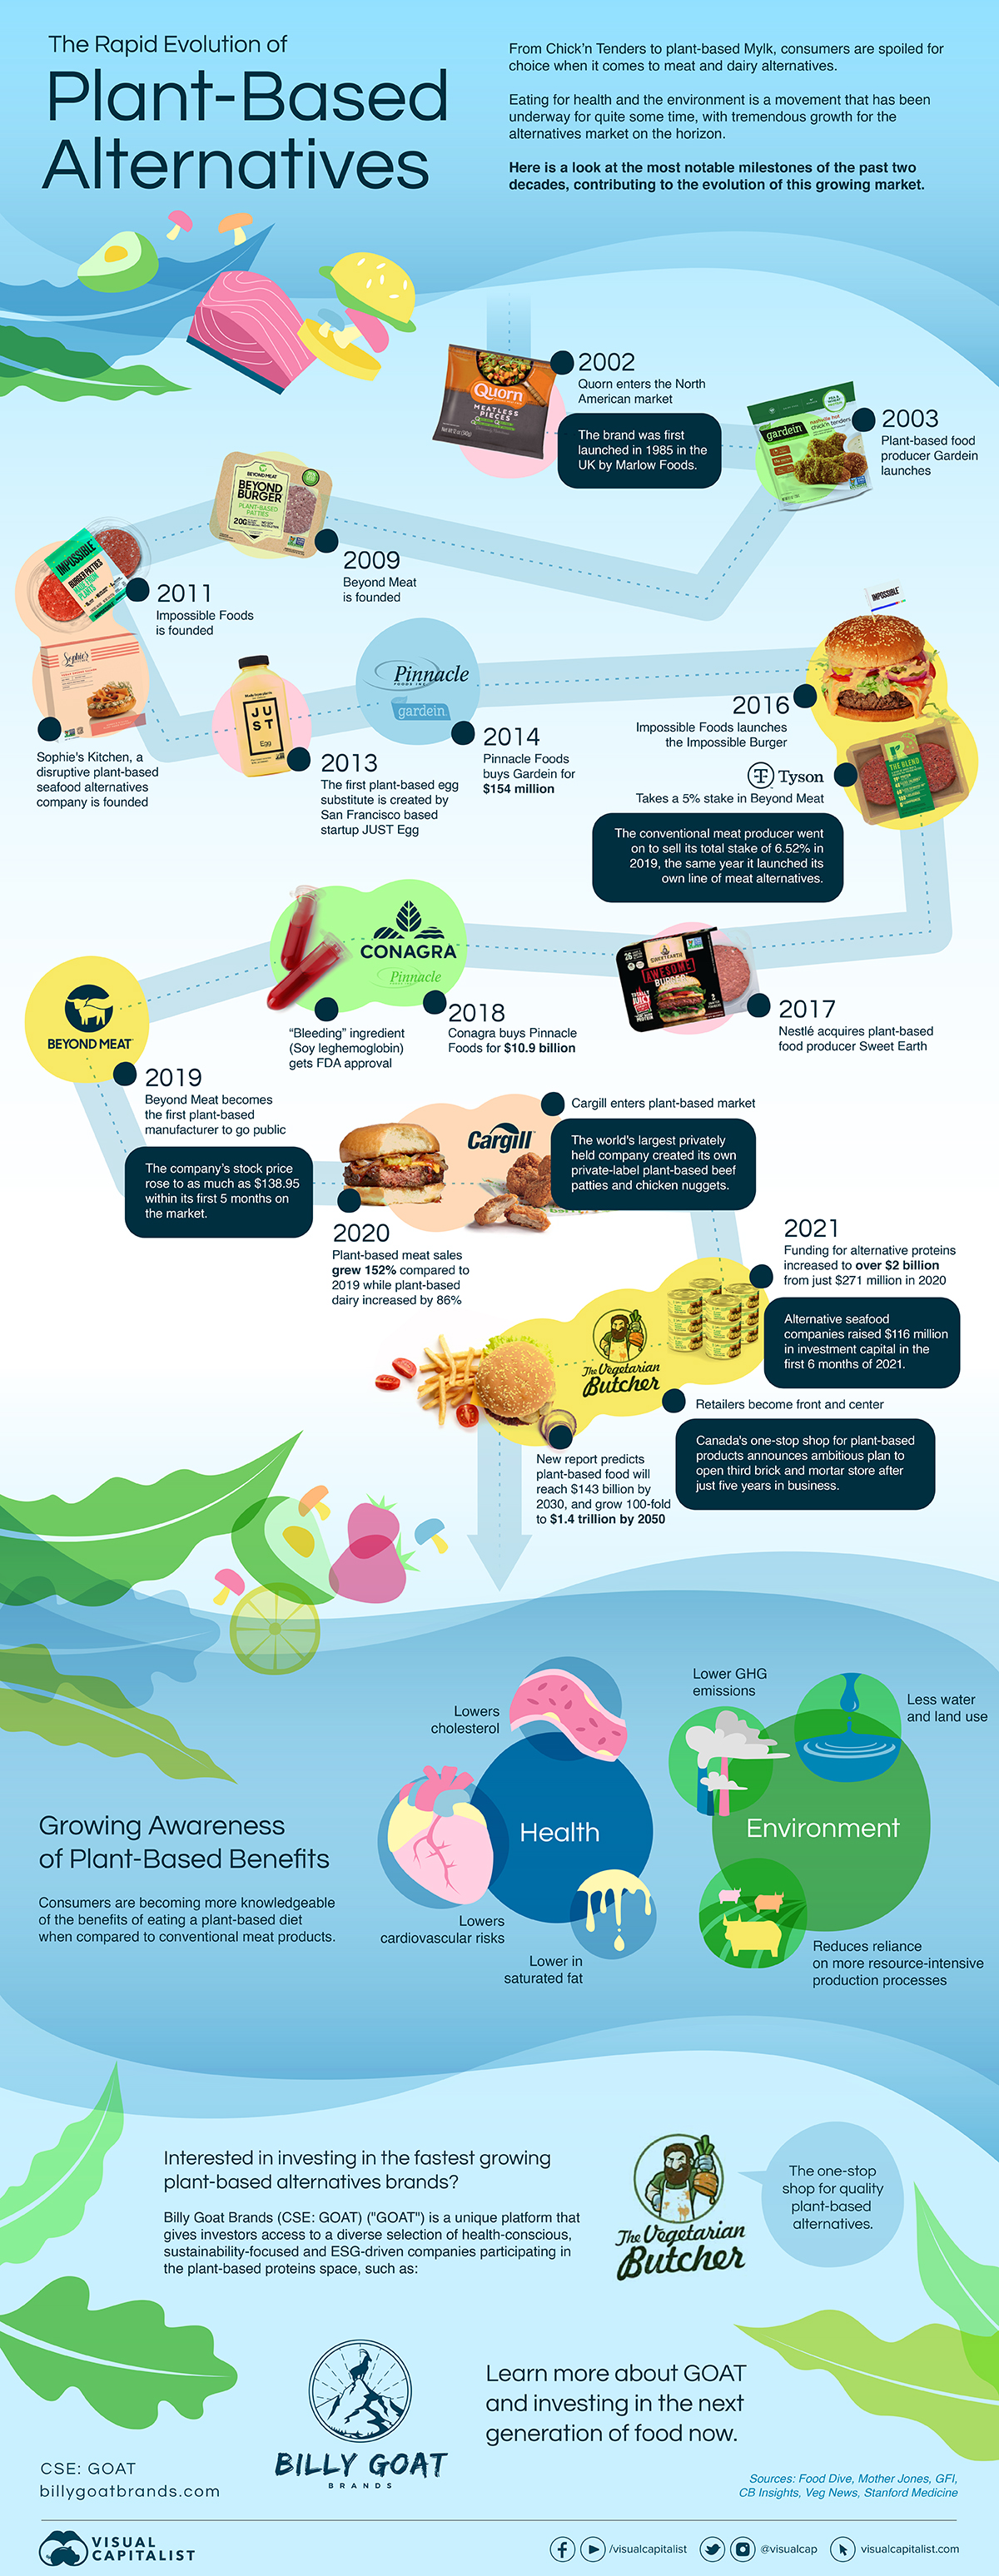
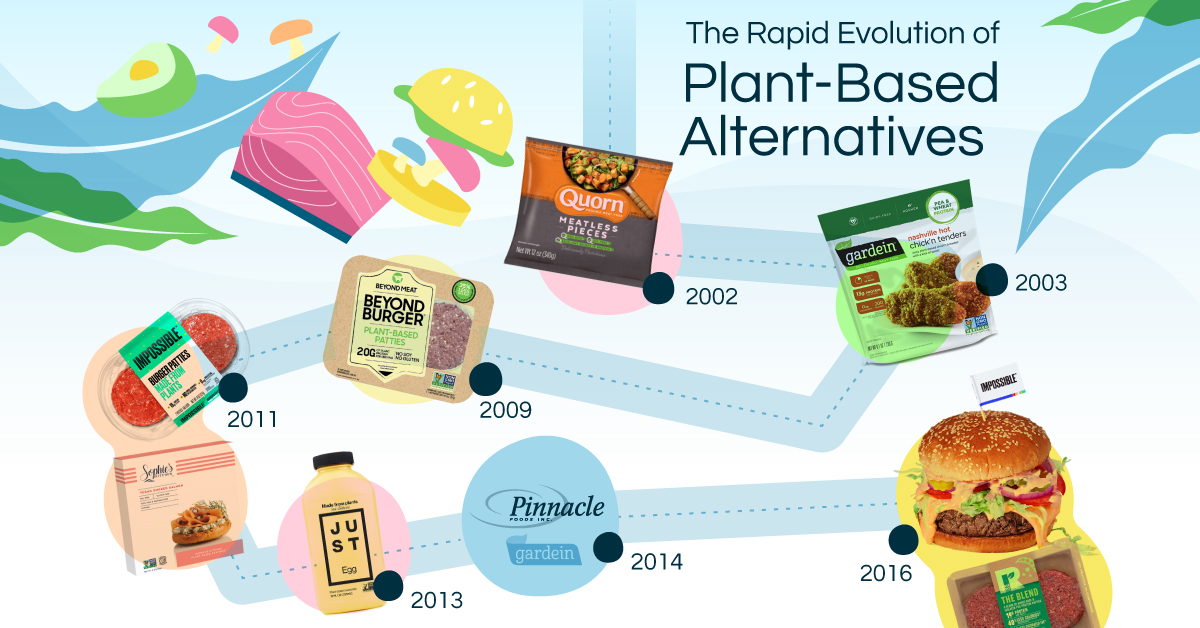
From plant-based Chick’n Tenders to dairy-free Mylk, consumers are spoilt for choice when it comes to alternatives products on the market.
With an explosion of new options hitting shelves at lightning speed and consumers growing more knowledgeable of plant-based diets, a shift towards eating less meat is being felt across the globe. But how did this movement come to be?
The infographic above from Billy Goat Brands (CSE: GOAT) (“GOAT”) maps out the most notable milestones in the last two decades that have contributed to the evolution of this growing market. Let’s dive in.
Key Events
Although it may feel like we are undergoing a massive transformation when it comes to alternatives, vegetarianism is nothing new. In fact, meat alternatives like tofu have been around since as early as 200 BCE.
Since then, many cultures have made plants a staple in their diet and as of 2021, there was an estimated 79 million people in the world who eat strictly plant-based.
In the table below, we break down the milestones of note that contributed to the growing plant-based market over the last 20 years:
Year | Key Event |
---|---|
2002 | Quorn enters the North American market |
2003 | Plant-based food producer Gardein launches |
2009 | Beyond Meat is founded |
2011 | Impossible Foods is founded |
2011 | Sophie’s Kitchen—a plant-based seafood alternatives company—is founded |
2013 | The first plant-based egg substitute is created by San Francisco based startup JUST Egg |
2014 | Pinnacle Foods buys Gardein for $154 million |
2016 | Impossible Foods launches the Impossible Burger |
2016 | Tyson takes a 5% stake in Beyond Meat |
2017 | Nestlé acquires plant-based food producer Sweet Earth |
2018 | Conagra buys Pinnacle Foods for $10.9 billion |
2018 | “Bleeding” ingredient (Soy leghemoglobin) gets FDA approval |
2019 | Beyond Meat becomes the first plant-based manufacturer to go public |
2020 | Plant-based meat sales grew 152% compared to 2019 while plant-based dairy increased by 86% |
2020 | Cargill enters plant-based market |
2021 | Funding for alternative proteins increased to over $2 billion from just $271 million in 2020 |
2021 | Plant-based retailers become more prominent |
2021 | New report predicts plant-based food will reach $143 billion by 2030, and grow 100-fold to $1.4 trillion by 2050 |
Despite disruptions in the supply chain, 2020 proved to be a pivotal year for alternatives products moving into the mainstream with more people realizing the many benefits that come with a plant-based lifestyle.
U.S. retail sales in 2020 shot up by a whopping 27% as a result, reaching $7 billion according to the Good Food Institute.
The Benefits of Eating Plant-Based
Plant-based alternatives can provide the same, if not more nutrients and protein as meat and dairy products. In fact, there is a long list of reasons why you should eat plant-based, as many alternatives on the market have proven to:
- Contain lower saturated fats
- Help lower cholesterol
- Help lower cardiovascular risks
On top of the health benefits, plant-based alternatives have also been shown to be a better option for the planet:
- Reduce reliance on more resource-intensive production processes
- Produce lower GHG emissions
- Require less water and land use compared to conventional meat production
Ultimately, the reasons for reaching for healthy alternatives far outweigh the benefits of eating conventional meat products.
Investing in the Next Generation of Food
GOAT is a unique platform that gives investors access to a diverse selection of health-conscious, sustainability-focused and ESG-driven companies in the alternatives space including The Vegetarian Butcher.
As Canada’s one-stop shop for high quality plant-based alternatives, The Vegetarian Butcher has recently announced its ambitious plan to open a third brick and mortar store after just five years in business.
Will you invest in the future of food?
Learn more about GOAT by clicking this link.
Sponsored
Ranked: Emissions per Capita of the Top 30 U.S. Investor-Owned Utilities
Roughly 25% of all GHG emissions come from electricity production. See how the top 30 IOUs rank by emissions per capita.

Emissions per Capita of the Top 30 U.S. Investor-Owned Utilities
Approximately 25% of all U.S. greenhouse gas emissions (GHG) come from electricity generation.
Subsequently, this means investor-owned utilities (IOUs) will have a crucial role to play around carbon reduction initiatives. This is particularly true for the top 30 IOUs, where almost 75% of utility customers get their electricity from.
This infographic from the National Public Utilities Council ranks the largest IOUs by emissions per capita. By accounting for the varying customer bases they serve, we get a more accurate look at their green energy practices. Here’s how they line up.
Per Capita Rankings
The emissions per capita rankings for the top 30 investor-owned utilities have large disparities from one another.
Totals range from a high of 25.8 tons of CO2 per customer annually to a low of 0.5 tons.
Utility | Emissions Per Capita (CO2 tons per year) | Total Emissions (M) |
---|---|---|
TransAlta | 25.8 | 16.3 |
Vistra | 22.4 | 97.0 |
OGE Energy | 21.5 | 18.2 |
AES Corporation | 19.8 | 49.9 |
Southern Company | 18.0 | 77.8 |
Evergy | 14.6 | 23.6 |
Alliant Energy | 14.4 | 14.1 |
DTE Energy | 14.2 | 29.0 |
Berkshire Hathaway Energy | 14.0 | 57.2 |
Entergy | 13.8 | 40.5 |
WEC Energy | 13.5 | 22.2 |
Ameren | 12.8 | 31.6 |
Duke Energy | 12.0 | 96.6 |
Xcel Energy | 11.9 | 43.3 |
Dominion Energy | 11.0 | 37.8 |
Emera | 11.0 | 16.6 |
PNM Resources | 10.5 | 5.6 |
PPL Corporation | 10.4 | 28.7 |
American Electric Power | 9.2 | 50.9 |
Consumers Energy | 8.7 | 16.1 |
NRG Energy | 8.2 | 29.8 |
Florida Power and Light | 8.0 | 41.0 |
Portland General Electric | 7.6 | 6.9 |
Fortis Inc. | 6.1 | 12.6 |
Avangrid | 5.1 | 11.6 |
PSEG | 3.9 | 9.0 |
Exelon | 3.8 | 34.0 |
Consolidated Edison | 1.6 | 6.3 |
Pacific Gas and Electric | 0.5 | 2.6 |
Next Era Energy Resources | 0 | 1.1 |
PNM Resources data is from 2019, all other data is as of 2020
Let’s start by looking at the higher scoring IOUs.
TransAlta
TransAlta emits 25.8 tons of CO2 emissions per customer, the largest of any utility on a per capita basis. Altogether, the company’s 630,000 customers emit 16.3 million metric tons. On a recent earnings call, its management discussed clear intent to phase out coal and grow their renewables mix by doubling their renewables fleet. And so far it appears they’ve been making good on their promise, having shut down the Canadian Highvale coal mine recently.
Vistra
Vistra had the highest total emissions at 97 million tons of CO2 per year and is almost exclusively a coal and gas generator. However, the company announced plans for 60% reductions in CO2 emissions by 2030 and is striving to be carbon neutral by 2050. As the highest total emitter, this transition would make a noticeable impact on total utility emissions if successful.
Currently, based on their 4.3 million customers, Vistra sees per capita emissions of 22.4 tons a year. The utility is a key electricity provider for Texas, ad here’s how their electricity mix compares to that of the state as a whole:
Energy Source | Vistra | State of Texas |
---|---|---|
Gas | 63% | 52% |
Coal | 29% | 15% |
Nuclear | 6% | 9% |
Renewables | 1% | 24% |
Oil | 1% | 0% |
Despite their ambitious green energy pledges, for now only 1% of Vistra’s electricity comes from renewables compared to 24% for Texas, where wind energy is prospering.
Based on those scores, the average customer from some of the highest emitting utility groups emit about the same as a customer from each of the bottom seven, who clearly have greener energy practices. Let’s take a closer look at emissions for some of the bottom scoring entities.
Utilities With The Greenest Energy Practices
Groups with the lowest carbon emission scores are in many ways leaders on the path towards a greener future.
Exelon
Exelon emits only 3.8 tons of CO2 emissions per capita annually and is one of the top clean power generators across the Americas. In the last decade they’ve reduced their GHG emissions by 18 million metric tons, and have recently teamed up with the state of Illinois through the Clean Energy Jobs Act. Through this, Exelon will receive $700 million in subsidies as it phases out coal and gas plants to meet 2030 and 2045 targets.
Consolidated Edison
Consolidated Edison serves nearly 4 million customers with a large chunk coming from New York state. Altogether, they emit 1.6 tons of CO2 emissions per capita from their electricity generation.
The utility group is making notable strides towards a sustainable future by expanding its renewable projects and testing higher capacity limits. In addition, they are often praised for their financial management and carry the title of dividend aristocrat, having increased their dividend for 47 years and counting. In fact, this is the longest out of any utility company in the S&P 500.
A Sustainable Tomorrow
Altogether, utilities will have a pivotal role to play in decarbonization efforts. This is particularly true for the top 30 U.S. IOUs, who collectively serve 60 million Americans, or one-fifth of the U.S. population.
Ultimately, this means a unique moment for utilities is emerging. As the transition toward cleaner energy continues and various groups push to achieve their goals, all eyes will be on utilities to deliver.
The National Public Utilities Council is the go-to resource to learn how utilities can lead in the path towards decarbonization.
Sponsored
The Road to Decarbonization: How Asphalt is Affecting the Planet
The U.S. alone generates ∼12 million tons of asphalt shingles tear-off waste and installation scrap every year and more than 90% of it is dumped into landfills.

The Road to Decarbonization: How Asphalt is Affecting the Planet
Asphalt, also known as bitumen, has various applications in the modern economy, with annual demand reaching 110 million tons globally.
Until the 20th century, natural asphalt made from decomposed plants accounted for the majority of asphalt production. Today, most asphalt is refined from crude oil.
This graphic, sponsored by Northstar Clean Technologies, shows how new technologies to reuse and recycle asphalt can help protect the environment.
The Impact of Climate Change
Pollution from vehicles is expected to decline as electric vehicles replace internal combustion engines.
But pollution from asphalt could actually increase in the next decades because of rising temperatures in some parts of the Earth. When subjected to extreme temperatures, asphalt releases harmful greenhouse gases (GHG) into the atmosphere.
Emissions from Road Construction (Source) | CO2 equivalent (%) |
---|---|
Asphalt | 28% |
Concrete | 18% |
Excavators and Haulers | 16% |
Trucks | 13% |
Crushing Plant | 10% |
Galvanized Steel | 6% |
Reinforced Steel | 6% |
Plastic Piping | 2% |
Geotextile | 1% |
Asphalt paved surfaces and roofs make up approximately 45% and 20% of surfaces in U.S. cities, respectively. Furthermore, 75% of single-family detached homes in Canada and the U.S. have asphalt shingles on their roofs.
Reducing the Environmental Impact of Asphalt
Similar to roads, asphalt shingles have oil as the primary component, which is especially harmful to the environment.
Shingles do not decompose or biodegrade. The U.S. alone generates ∼12 million tons of asphalt shingles tear-off waste and installation scrap every year and more than 90% of it is dumped into landfills, the equivalent of 20 million barrels of oil.
But most of it can be reused, rather than taking up valuable landfill space.
Using technology, the primary components in shingles can be repurposed into liquid asphalt, aggregate, and fiber, for use in road construction, embankments, and new shingles.
Providing the construction industry with clean, sustainable processing solutions is also a big business opportunity. Canada alone is a $1.3 billion market for recovering and reprocessing shingles.
Northstar Clean Technologies is the only public company that repurposes 99% of asphalt shingles components that otherwise go to landfills.
-
Misc5 days ago
The Top 10 Largest Nuclear Explosions, Visualized
-
Technology3 weeks ago
How Do Big Tech Giants Make Their Billions?
-
Green4 weeks ago
Visualizing All Electric Car Models Available in the U.S.
-
Markets4 weeks ago
Satellite Maps: Shanghai’s Supply Chain Standstill
-
Energy1 week ago
Mapped: Solar and Wind Power by Country
-
Datastream3 weeks ago
Visualizing Companies with the Most Patents Granted in 2021
-
Technology1 week ago
Synthetic Biology: The $3.6 Trillion Science Changing Life as We Know It
-
Markets3 weeks ago
Why Investors Tuned Out Netflix