Datastream
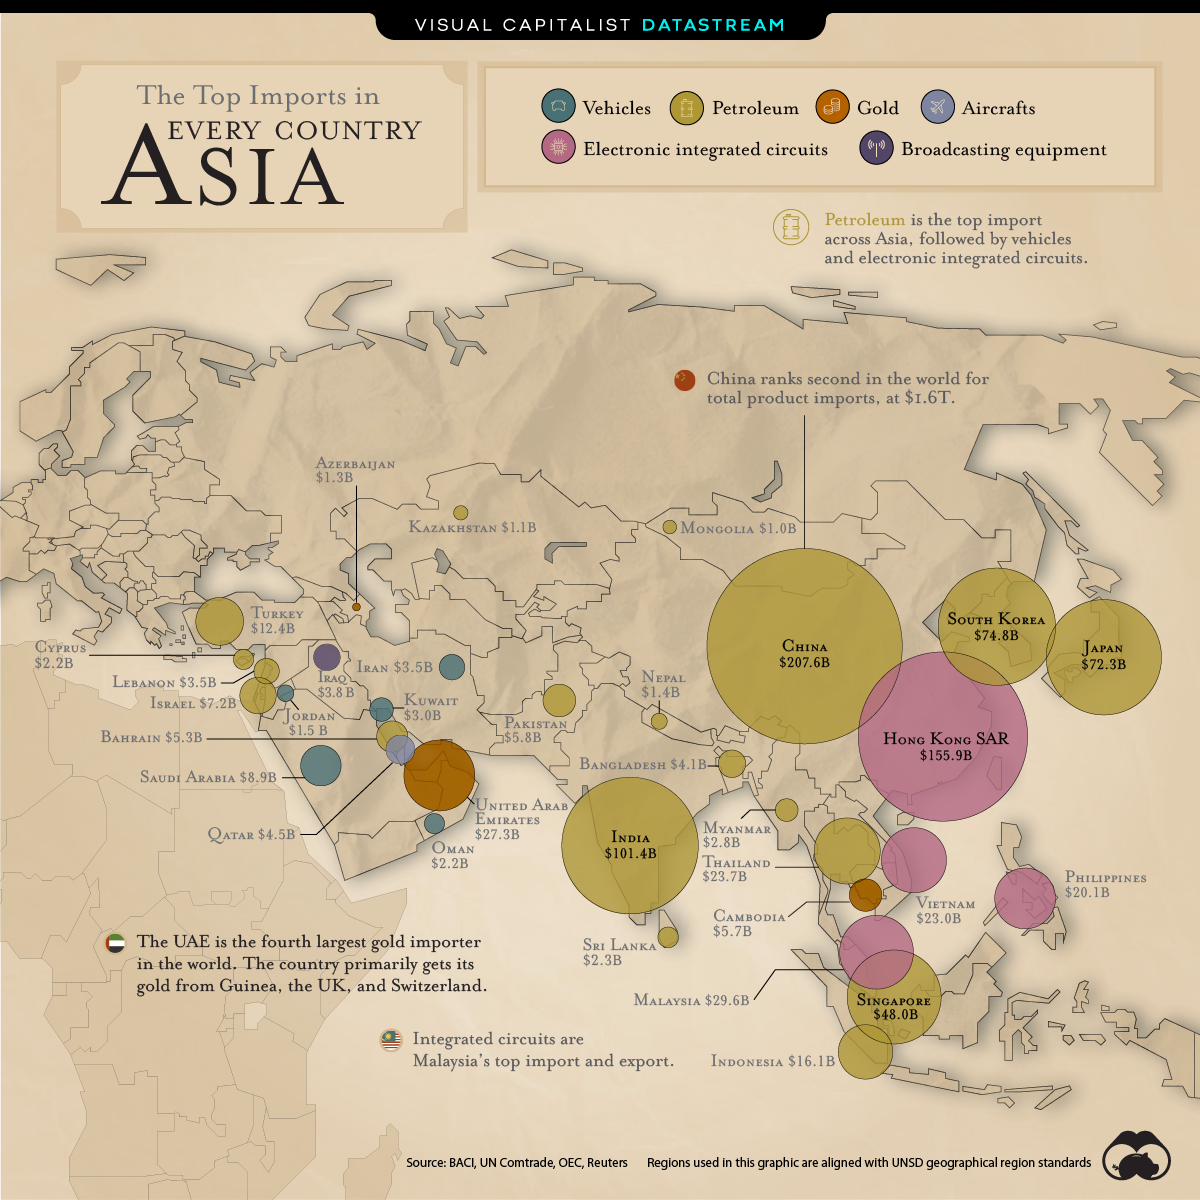
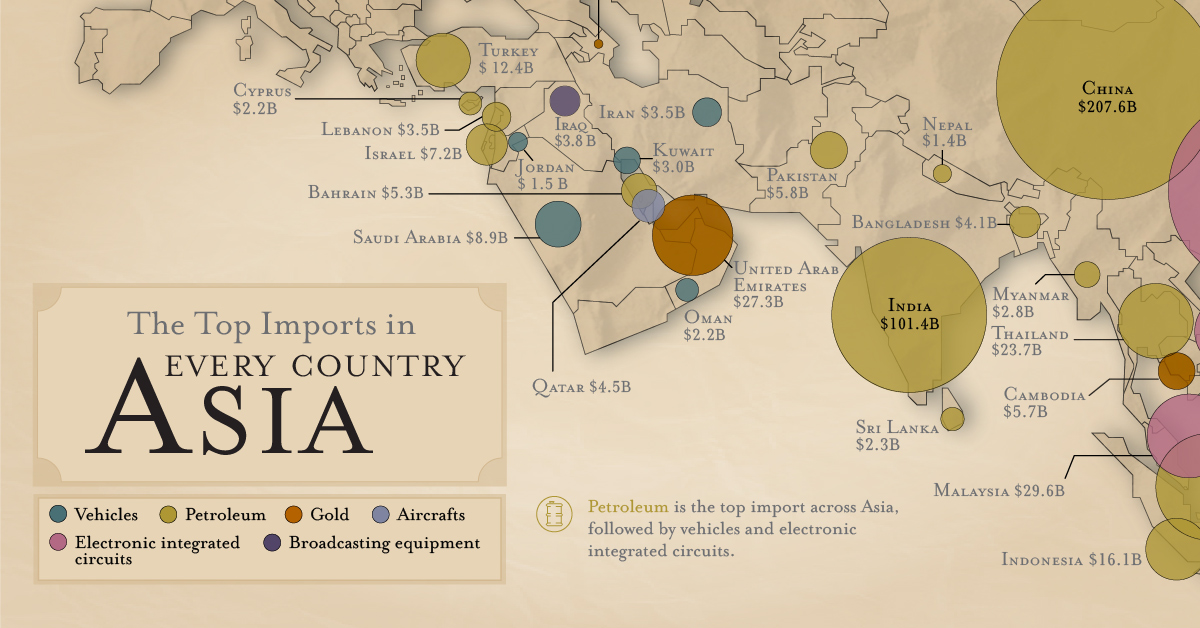
The Top Import for Each Country: Asia
The Briefing
- Petroleum is the most popular import across Asia
- China imports the most petroleum in Asia—in 2018, it brought in over $207 billion worth
- China is the world’s second largest importer (the U.S. comes in at number one)
The Top Imports in Asia
By 2040, Asia is projected to make up 40% of worldwide consumption. What types of goods and products are in high demand by the world’s (soon-to-be) largest consumer? One way to tackle this question is by looking at the top imports across Asia.
The map above does just that. For brevity, we’ve excluded regions with a top import value below $1 billion.
Top Imports in Asia, by Country
Just like the Americas, petroleum is the most popular import in Asia. In fact, it’s the top import in 19 of the 34 countries included on this list, including in China where over $200 billion worth of petroleum was imported in 2018:
| Country | Region | Top Import | Import Value (2018, USD) |
|---|---|---|---|
| 🇨🇳 China | Eastern Asia | Petroleum | $207.6 B |
| 🇭🇰 China, Hong Kong SAR | Eastern Asia | Electronic integrated circuits | $155.9 B |
| 🇮🇳 India | Southern Asia | Petroleum | $101.4 B |
| 🇰🇷 South Korea | Eastern Asia | Petroleum | $74.8B |
| 🇯🇵 Japan | Eastern Asia | Petroleum | $72.3B |
| 🇸🇬 Singapore | South-eastern Asia | Petroleum | $48.0 B |
| 🇲🇾 Malaysia | South-eastern Asia | Electronic integrated circuits | $29.6 B |
| 🇦🇪 United Arab Emirates | Western Asia | Gold | $ 27.3 B |
| 🇹🇭 Thailand | South-eastern Asia | Petroleum | $23.7 B |
| 🇻🇳 Vietnam | South-eastern Asia | Electronic integrated circuits | $23.0 B |
| 🇵🇭 Philippines | South-eastern Asia | Electronic integrated circuits | $20.1 B |
| 🇮🇩 Indonesia | South-eastern Asia | Petroleum | $16.1 B |
| 🇹🇷 Turkey | Western Asia | Petroleum | $12.4 B |
| 🇸🇦 Saudi Arabia | Western Asia | Vehicles | $8.9 B |
| 🇮🇱 Israel | Western Asia | Petroleum | $7.2 B |
| 🇵🇰 Pakistan | Southern Asia | Petroleum | $5.8 B |
| 🇰🇭 Cambodia | South-eastern Asia | Gold | $5.7 B |
| 🇧🇭 Bahrain | Western Asia | Petroleum | $5.3 B |
| 🇶🇦 Qatar | Western Asia | Aircrafts | $4.5 B |
| 🇧🇩 Bangladesh | Southern Asia | Petroleum | $4.1 B |
| 🇮🇶 Iraq | Western Asia | Broadcasting equipment | $3.8 B |
| 🇮🇷 Iran | Southern Asia | Vehicles | $3.5 B |
| 🇱🇧 Lebanon | Western Asia | Petroleum | $3.5 B |
| 🇰🇼 Kuwait | Western Asia | Vehicles | $3.0 B |
| 🇲🇲 Myanmar | South-eastern Asia | Petroleum | $2.8 B |
| 🇱🇰 Sri Lanka | Southern Asia | Petroleum | $2.3 B |
| 🇴🇲 Oman | Western Asia | Vehicles | $2.2 B |
| 🇨🇾 Cyprus | Western Asia | Petroleum | $2.2 B |
| 🇯🇴 Jordan | Western Asia | Vehicles | $1.5 B |
| 🇳🇵 Nepal | Southern Asia | Petroleum | $1.4 B |
| 🇦🇿 Azerbaijan | Western Asia | Gold | $1.3 B |
| 🇰🇿 Kazakhstan | Central Asia | Petroleum | $1.1 B |
| 🇲🇳 Mongolia | Eastern Asia | Petroleum | $1.0 B |
Vehicles are the second most popular, ranking first in five countries. Saudi Arabia is the top importer of vehicles, with an import value of $8.9 billion in 2018.
In third place, electronic integrated circuits, which are small chips used in electronic devices, rank as the top import in four countries. Three of those are in South-eastern Asia, which makes sense considering the region is becoming Asia’s manufacturing hub.
Hong Kong is the top importer of integrated circuits—not just across Asia, but worldwide. Interestingly, integrated circuits are also Hong Kong’s top export. Because many of Hong Kong’s manufacturing facilities have been relocated to China, the region’s electronics industry focuses on R&D, product design, and logistics.
>> Interested in global trade? You should check out this article: The Top Import for Each Country: The Americas
Where does this data come from?
Source: BACI, UN Comtrade
Details: BACI is an international trade database, providing information on bilateral trade flows for more than 5000 products and 200 countries. It pulls data directly from the United Nations Statistical Division (UN Comtrade)
Notes: For more information on methodology, visit the CEPII website


Datastream
Can You Calculate Your Daily Carbon Footprint?
Discover how the average person’s carbon footprint impacts the environment and learn how carbon credits can offset your carbon footprint.


The Briefing
- A person’s carbon footprint is substantial, with activities such as food consumption creating as much as 4,500 g of CO₂ emissions daily.
- By purchasing carbon credits from Carbon Streaming Corporation, you can offset your own emissions and fund positive climate action.
Your Everyday Carbon Footprint
While many large businesses and countries have committed to net-zero goals, it is essential to acknowledge that your everyday activities also contribute to global emissions.
In this graphic, sponsored by Carbon Streaming Corporation, we will explore how the choices we make and the products we use have a profound impact on our carbon footprint.
Carbon Emissions by Activity
Here are some of the daily activities and products of the average person and their carbon footprint, according to Clever Carbon.
| Household Activities & Products | CO2 Emissions (g) |
|---|---|
| 💡 Standard Light Bulb (100 watts, four hours) | 172 g |
| 📱 Mobile Phone Use (195 minutes per day)* | 189 g |
| 👕 Washing Machine (0.63 kWh) | 275 g |
| 🔥 Electric Oven (1.56 kWh) | 675 g |
| ♨️ Tumble Dryer (2.5 kWh) | 1,000 g |
| 🧻 Toilet Roll (2 ply) | 1,300 g |
| 🚿 Hot Shower (10 mins) | 2,000 g |
| 🚙 Daily Commute (one hour, by car) | 3,360 g |
| 🍽️ Average Daily Food Consumption (three meals of 600 calories) | 4,500 g |
| *Phone use based on yearly use of 69kg per the source, Reboxed | |
Your choice of transportation plays a crucial role in determining your carbon footprint. For instance, a 15 km daily commute to work on public transport generates an average of 1,464 g of CO₂ emissions. Compared to 3,360 g—twice the volume for a journey the same length by car.
By opting for more sustainable modes of transport, such as cycling, walking, or public transportation, you can significantly reduce your carbon footprint.
Addressing Your Carbon Footprint
One way to compensate for your emissions is by purchasing high-quality carbon credits.
Carbon credits are used to help fund projects that avoid, reduce or remove CO₂ emissions. This includes nature-based solutions such as reforestation and improved forest management, or technology-based solutions such as the production of biochar and carbon capture and storage (CCS).
While carbon credits offer a potential solution for individuals to help reduce global emissions, public awareness remains a significant challenge. A BCG-Patch survey revealed that only 34% of U.S. consumers are familiar with carbon credits, and only 3% have purchased them in the past.
About Carbon Streaming
By financing the creation or expansion of carbon projects, Carbon Streaming Corporation secures the rights to future carbon credits generated by these sustainable projects. You can then purchase these carbon credits to help fund climate solutions around the world and compensate for your own emissions.
Ready to get involved?
>> Learn more about purchasing carbon credits at Carbon Streaming

-

 Mining1 week ago
Gold vs. S&P 500: Which Has Grown More Over Five Years?
-

 Markets2 weeks ago
Ranked: The Most Valuable Housing Markets in America
-

 Money2 weeks ago
Which States Have the Highest Minimum Wage in America?
-

 AI2 weeks ago
Ranked: Semiconductor Companies by Industry Revenue Share
-

 Markets2 weeks ago
Ranked: The World’s Top Flight Routes, by Revenue
-

 Countries2 weeks ago
Population Projections: The World’s 6 Largest Countries in 2075
-

 Markets2 weeks ago
The Top 10 States by Real GDP Growth in 2023
-

 Demographics2 weeks ago
The Smallest Gender Wage Gaps in OECD Countries