Datastream
The Top Import for Each Country: The Americas


The Briefing
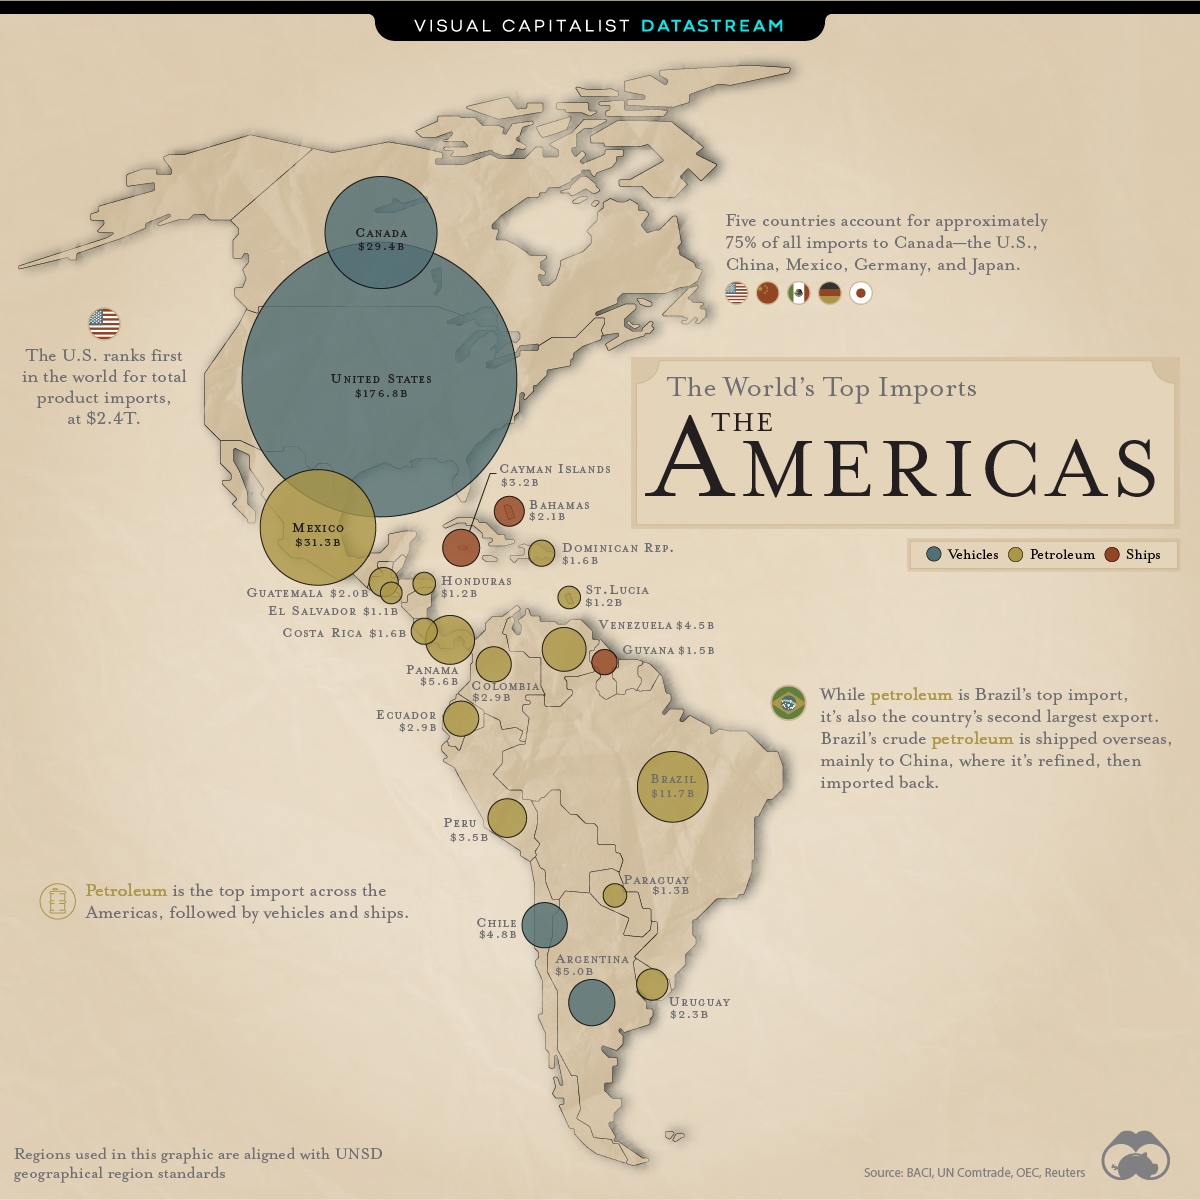
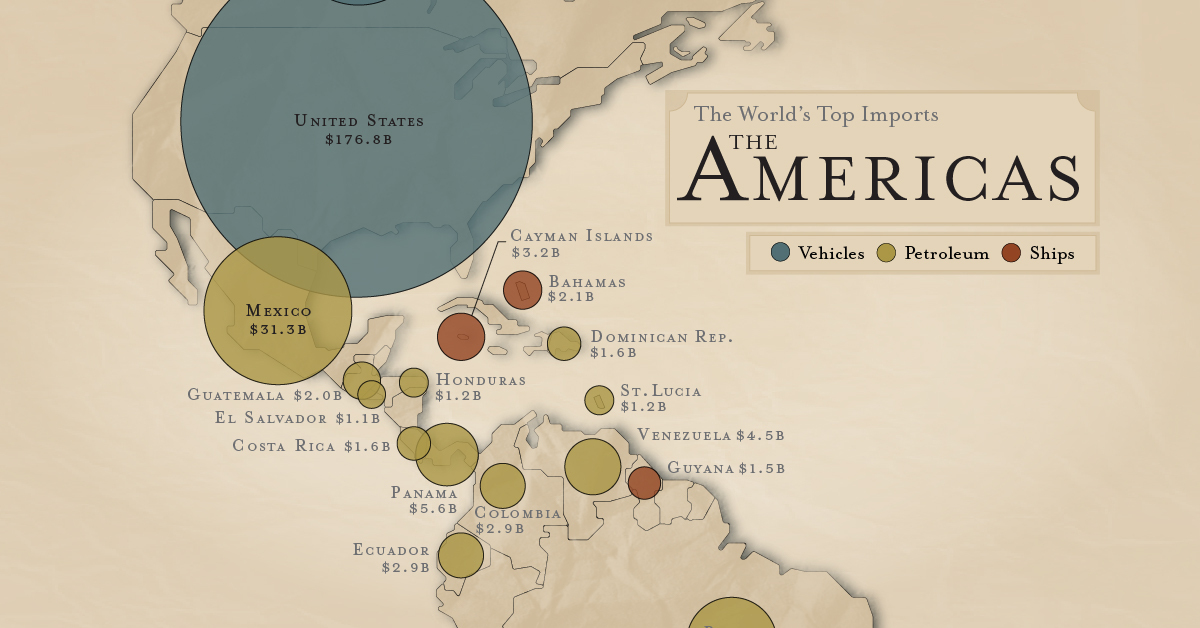
- Petroleum is the top import across the Americas (Northern America, the Caribbean, Central America, and South America)
- The U.S. is the #1 importer worldwide. In 2018, its total product import value reached $2.4T
The Top Import in Each Country: The Americas
Almost all nations across the globe import goods from other countries. But what types of products are in high demand, and to what degree are these hot commodities exchanged worldwide?
Today’s graphic provides an overview of the top imports across the Americas. For brevity, we’ve excluded regions with an import value below $1 billion.
The Top Imports, by Country
Petroleum is the most popular import across the Americas region. In fact, it’s the top import in 15 of the 22 countries included on this list:
| Country / Region | Continent | Top Import | Import Value (2018, $B USD) |
|---|---|---|---|
| 🇨🇦 Canada | Northern America | Vehicles | 29.4 |
| 🇺🇸 United States of America | Northern America | Vehicles | 176.8 |
| 🇰🇾 Cayman Islands | The Caribbean | Ships | 3.2 |
| 🇧🇸 Bahamas | The Caribbean | Ships | 2.1 |
| 🇩🇴 Dominican Republic | The Caribbean | Petroleum | 1.6 |
| 🇱🇨 Saint Lucia | The Caribbean | Petroleum | 1.2 |
| 🇲🇽 Mexico | Central America | Petroleum | 31.3 |
| 🇵🇦 Panama | Central America | Petroleum | 5.6 |
| 🇬🇹 Guatemala | Central America | Petroleum | 2.0 |
| 🇨🇷 Costa Rica | Central America | Petroleum | 1.6 |
| 🇸🇻 El Salvador | Central America | Petroleum | 1.1 |
| 🇭🇳 Honduras | Central America | Petroleum | 1.2 |
| 🇧🇷 Brazil | South America | Petroleum | 11.7 |
| 🇦🇷 Argentina | South America | Vehicles | 5.0 |
| 🇨🇱 Chile | South America | Vehicles | 4.8 |
| 🇻🇪 Venezuela (Bolivarian Republic of) | South America | Petroleum | 4.5 |
| 🇵🇪 Peru | South America | Petroleum | 3.5 |
| 🇪🇨 Ecuador | South America | Petroleum | 2.9 |
| 🇨🇴 Colombia | South America | Petroleum | 2.9 |
| 🇺🇾 Uruguay | South America | Petroleum | 2.3 |
| 🇬🇾 Guyana | South America | Ships | 1.5 |
| 🇵🇾 Paraguay | South America | Petroleum | 1.3 |
Vehicles are the second most popular, ranking as the number one import in four of the 22 countries. Cars are particularly popular in Northern America— they’re the top import in both the U.S. and Canada.
Lastly, ships place third, snagging the top spot in three of the 22 countries. Interestingly, two of these nations are in the Caribbean.
The Top 10 Regions, by Import Value
When looking at which nations import the most of their top product, the U.S. leads the pack.
In 2018, the U.S. imported $176.8 billion worth of foreign vehicles—around $147 billion more than its northern neighbor, Canada:
| Region | Top Import | Import Value (2018, $B USD) |
|---|---|---|
| 🇺🇸 United States of America | Vehicles | 176.8 |
| 🇨🇦 Canada | Vehicles | 29.4 |
| 🇲🇽 Mexico | Petroleum | 31.3 |
| 🇧🇷 Brazil | Petroleum | 11.7 |
| 🇵🇦 Panama | Petroleum | 5.6 |
| 🇦🇷 Argentina | Vehicles | 5.0 |
| 🇨🇱 Chile | Vehicles | 4.8 |
| 🇻🇪 Venezuela (Bolivarian Republic of) | Petroleum | 4.5 |
| 🇵🇪 Peru | Petroleum | 3.5 |
| 🇰🇾 Cayman Islands | Ships | 3.2 |
The U.S. relies heavily on Mexico for its foreign vehicles—it imported over 2 million light vehicles from south of the border in 2018. Manufacturing of vehicles and associated parts makes up nearly 18% of Mexico’s total exports.
Yet, while the U.S. imports a lot of foreign cars, the country exports its fair share of vehicles as well, especially to Canada. In fact, the U.S. is Canada’s top source for imported vehicles.
The high volume of trade between Mexico, the U.S. and Canada is fairly unsurprising, given the trade agreement between the three countries. Since the North American Free Trade Agreement (NAFTA) came into effect in 1994, Mexico in particular has seen a significant boost in trade activity. In 2018, imports accounted for 39% of Mexico’s GDP—a 21 percentage point rise from 1994.
»To learn more about the top imports worldwide, read our full article Mapped: The World’s Biggest Importers in 2018
Where does this data come from?
Source: BACI, UN Comtrade
Details: BACI is an international trade database, providing information on bilateral trade flows for more than 5000 products and 200 countries. It pulls data directly from the United Nations Statistical Division (UN Comtrade)
Notes: For more information on methodology, visit the CEPII website


Datastream
Can You Calculate Your Daily Carbon Footprint?
Discover how the average person’s carbon footprint impacts the environment and learn how carbon credits can offset your carbon footprint.


The Briefing
- A person’s carbon footprint is substantial, with activities such as food consumption creating as much as 4,500 g of CO₂ emissions daily.
- By purchasing carbon credits from Carbon Streaming Corporation, you can offset your own emissions and fund positive climate action.
Your Everyday Carbon Footprint
While many large businesses and countries have committed to net-zero goals, it is essential to acknowledge that your everyday activities also contribute to global emissions.
In this graphic, sponsored by Carbon Streaming Corporation, we will explore how the choices we make and the products we use have a profound impact on our carbon footprint.
Carbon Emissions by Activity
Here are some of the daily activities and products of the average person and their carbon footprint, according to Clever Carbon.
| Household Activities & Products | CO2 Emissions (g) |
|---|---|
| 💡 Standard Light Bulb (100 watts, four hours) | 172 g |
| 📱 Mobile Phone Use (195 minutes per day)* | 189 g |
| 👕 Washing Machine (0.63 kWh) | 275 g |
| 🔥 Electric Oven (1.56 kWh) | 675 g |
| ♨️ Tumble Dryer (2.5 kWh) | 1,000 g |
| 🧻 Toilet Roll (2 ply) | 1,300 g |
| 🚿 Hot Shower (10 mins) | 2,000 g |
| 🚙 Daily Commute (one hour, by car) | 3,360 g |
| 🍽️ Average Daily Food Consumption (three meals of 600 calories) | 4,500 g |
| *Phone use based on yearly use of 69kg per the source, Reboxed | |
Your choice of transportation plays a crucial role in determining your carbon footprint. For instance, a 15 km daily commute to work on public transport generates an average of 1,464 g of CO₂ emissions. Compared to 3,360 g—twice the volume for a journey the same length by car.
By opting for more sustainable modes of transport, such as cycling, walking, or public transportation, you can significantly reduce your carbon footprint.
Addressing Your Carbon Footprint
One way to compensate for your emissions is by purchasing high-quality carbon credits.
Carbon credits are used to help fund projects that avoid, reduce or remove CO₂ emissions. This includes nature-based solutions such as reforestation and improved forest management, or technology-based solutions such as the production of biochar and carbon capture and storage (CCS).
While carbon credits offer a potential solution for individuals to help reduce global emissions, public awareness remains a significant challenge. A BCG-Patch survey revealed that only 34% of U.S. consumers are familiar with carbon credits, and only 3% have purchased them in the past.
About Carbon Streaming
By financing the creation or expansion of carbon projects, Carbon Streaming Corporation secures the rights to future carbon credits generated by these sustainable projects. You can then purchase these carbon credits to help fund climate solutions around the world and compensate for your own emissions.
Ready to get involved?
>> Learn more about purchasing carbon credits at Carbon Streaming

-

 Mining1 week ago
Gold vs. S&P 500: Which Has Grown More Over Five Years?
-

 Markets2 weeks ago
Ranked: The Most Valuable Housing Markets in America
-

 Money2 weeks ago
Which States Have the Highest Minimum Wage in America?
-

 AI2 weeks ago
Ranked: Semiconductor Companies by Industry Revenue Share
-

 Markets2 weeks ago
Ranked: The World’s Top Flight Routes, by Revenue
-

 Countries2 weeks ago
Population Projections: The World’s 6 Largest Countries in 2075
-

 Markets2 weeks ago
The Top 10 States by Real GDP Growth in 2023
-

 Demographics2 weeks ago
The Smallest Gender Wage Gaps in OECD Countries