Datastream
Why Investors Are Psyched About Psychedelic Stocks

The Briefing
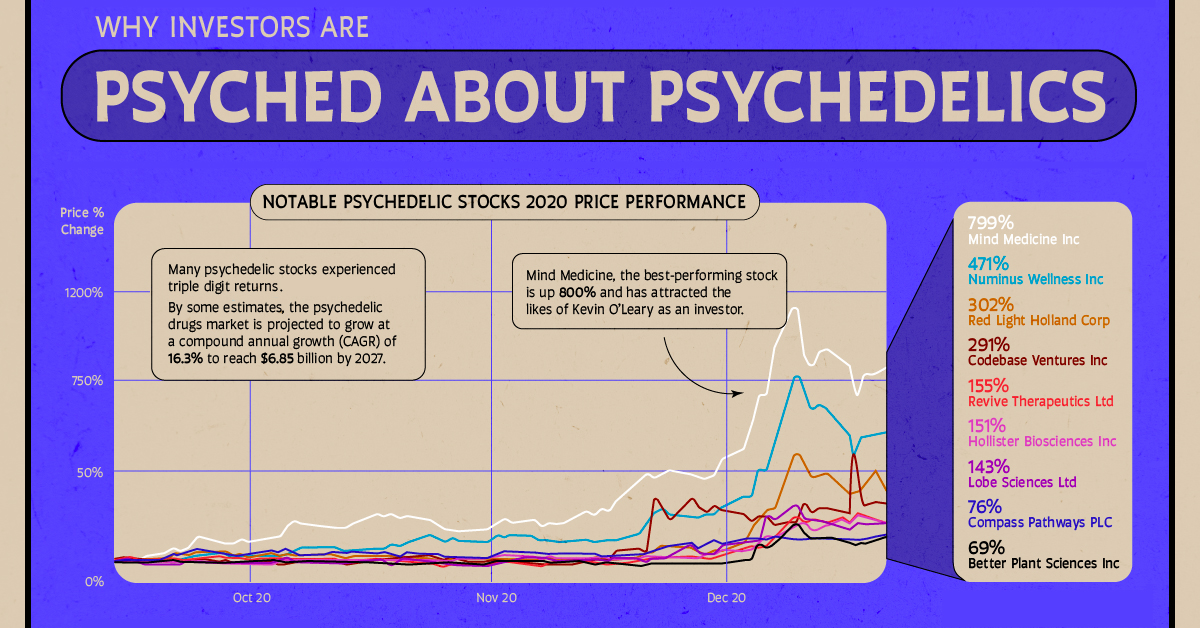
- Plenty of psychedelic stocks have experienced triple-digit returns in the last year
- Optimism is brewing as governments grant research approvals for the study of psychedelics on mental health
- By some estimates, the psychedelic drugs market is projected to see compound annual growth (CAGR) of 16.3% to reach $6.85 billion by 2027
Psyched About Psychedelics
Psychedelic stocks are trading like biotechnology companies these days. The prospect of promising research has pushed valuations upwards. And like biotech companies, they often report no revenues and are a volatile bunch.
Awareness around mental health disorders is increasing, as are the number of people who suffer from them—a figure exacerbated by the pandemic. Although these factors are grim, they are actually catalysts for psychedelic stocks.
The Societal Cost
Today, greater emphasis is put towards combating mental health. In part because its societal cost is increasingly difficult to ignore. And the solutions to them may take on various forms. For instance, alternative medication.
There are over 100 million people who are resistant to traditional treatments for depression. Some studies reveal up to ⅓ of patients experience treatment-resistant depression.
As a result, this is where the application of psychedelics in microdoses is perceived to add value—and where a market may arise.
Regulatory Status
1. Health Canada
Health Canada granted 16 exemptions to a selection of nurses, doctors, therapists and social workers. Thus, allowing them to possess and use psilocybin for personal training without fear of prosecution under the country’s drug laws.
2. The FDA
The FDA declared psychedelics a breakthrough therapy for severe depression.
3. The State of Oregon
Oregon approves a legal framework for the therapeutic use of psilocybin. Becoming the first state to do so.
Mushrooming Valuations
Investors love a good story. And legalizing psychedelic drugs to combat the growing societal challenge that is mental health is as good as it gets.
| Psychedelic Stock | 2020 Stock Price Performance |
|---|---|
| Mind Medicine | 864% |
| Numinus Wellness | 555% |
| Red Light Holland | 300% |
| Codebase Ventures | 210% |
| Revive Therapeutics | 166% |
| Hollister Biosciences | 148% |
| Lobe Sciences | 133% |
| Compass Pathways | 88% |
| Better Plant Sciences | 76% |
Some of the earlier research and studies on psychedelics are expected to be released by mid-2021, and investors are already getting ahead of this in optimistic anticipation. This is evident in the valuations of some of these companies, which in some cases are already reaching a billion dollars.
Welcome to the shroom boom.
Where does this data come from?
Source:YCharts & Frontiers In Psychology
Notes: This data was released on September 4, 2020


Datastream
Can You Calculate Your Daily Carbon Footprint?
Discover how the average person’s carbon footprint impacts the environment and learn how carbon credits can offset your carbon footprint.


The Briefing
- A person’s carbon footprint is substantial, with activities such as food consumption creating as much as 4,500 g of CO₂ emissions daily.
- By purchasing carbon credits from Carbon Streaming Corporation, you can offset your own emissions and fund positive climate action.
Your Everyday Carbon Footprint
While many large businesses and countries have committed to net-zero goals, it is essential to acknowledge that your everyday activities also contribute to global emissions.
In this graphic, sponsored by Carbon Streaming Corporation, we will explore how the choices we make and the products we use have a profound impact on our carbon footprint.
Carbon Emissions by Activity
Here are some of the daily activities and products of the average person and their carbon footprint, according to Clever Carbon.
| Household Activities & Products | CO2 Emissions (g) |
|---|---|
| 💡 Standard Light Bulb (100 watts, four hours) | 172 g |
| 📱 Mobile Phone Use (195 minutes per day)* | 189 g |
| 👕 Washing Machine (0.63 kWh) | 275 g |
| 🔥 Electric Oven (1.56 kWh) | 675 g |
| ♨️ Tumble Dryer (2.5 kWh) | 1,000 g |
| 🧻 Toilet Roll (2 ply) | 1,300 g |
| 🚿 Hot Shower (10 mins) | 2,000 g |
| 🚙 Daily Commute (one hour, by car) | 3,360 g |
| 🍽️ Average Daily Food Consumption (three meals of 600 calories) | 4,500 g |
| *Phone use based on yearly use of 69kg per the source, Reboxed | |
Your choice of transportation plays a crucial role in determining your carbon footprint. For instance, a 15 km daily commute to work on public transport generates an average of 1,464 g of CO₂ emissions. Compared to 3,360 g—twice the volume for a journey the same length by car.
By opting for more sustainable modes of transport, such as cycling, walking, or public transportation, you can significantly reduce your carbon footprint.
Addressing Your Carbon Footprint
One way to compensate for your emissions is by purchasing high-quality carbon credits.
Carbon credits are used to help fund projects that avoid, reduce or remove CO₂ emissions. This includes nature-based solutions such as reforestation and improved forest management, or technology-based solutions such as the production of biochar and carbon capture and storage (CCS).
While carbon credits offer a potential solution for individuals to help reduce global emissions, public awareness remains a significant challenge. A BCG-Patch survey revealed that only 34% of U.S. consumers are familiar with carbon credits, and only 3% have purchased them in the past.
About Carbon Streaming
By financing the creation or expansion of carbon projects, Carbon Streaming Corporation secures the rights to future carbon credits generated by these sustainable projects. You can then purchase these carbon credits to help fund climate solutions around the world and compensate for your own emissions.
Ready to get involved?
>> Learn more about purchasing carbon credits at Carbon Streaming

-

 Maps1 week ago
The Largest Earthquakes in the New York Area (1970-2024)
-

 Money2 weeks ago
Where Does One U.S. Tax Dollar Go?
-

 Misc2 weeks ago
Almost Every EV Stock is Down After Q1 2024
-

 AI2 weeks ago
The Stock Performance of U.S. Chipmakers So Far in 2024
-

 Markets2 weeks ago
Charted: Big Four Market Share by S&P 500 Audits
-

 Real Estate2 weeks ago
Ranked: The Most Valuable Housing Markets in America
-

 Money2 weeks ago
Which States Have the Highest Minimum Wage in America?
-

 AI2 weeks ago
Ranked: Semiconductor Companies by Industry Revenue Share