Automotive
The Most Fuel Efficient Cars From 1975 to Today


The Most Fuel Efficient Cars From 1975 to Today
When shopping for a new car, what is the most important factor you look for? According to Statista, it’s not design, quality, or even safety—it’s fuel efficiency.
Because of this, automakers are always looking for clever ways to improve gas mileage in their cars. Beating the competition by even the slimmest of margins can give valuable bragging rights within a segment.
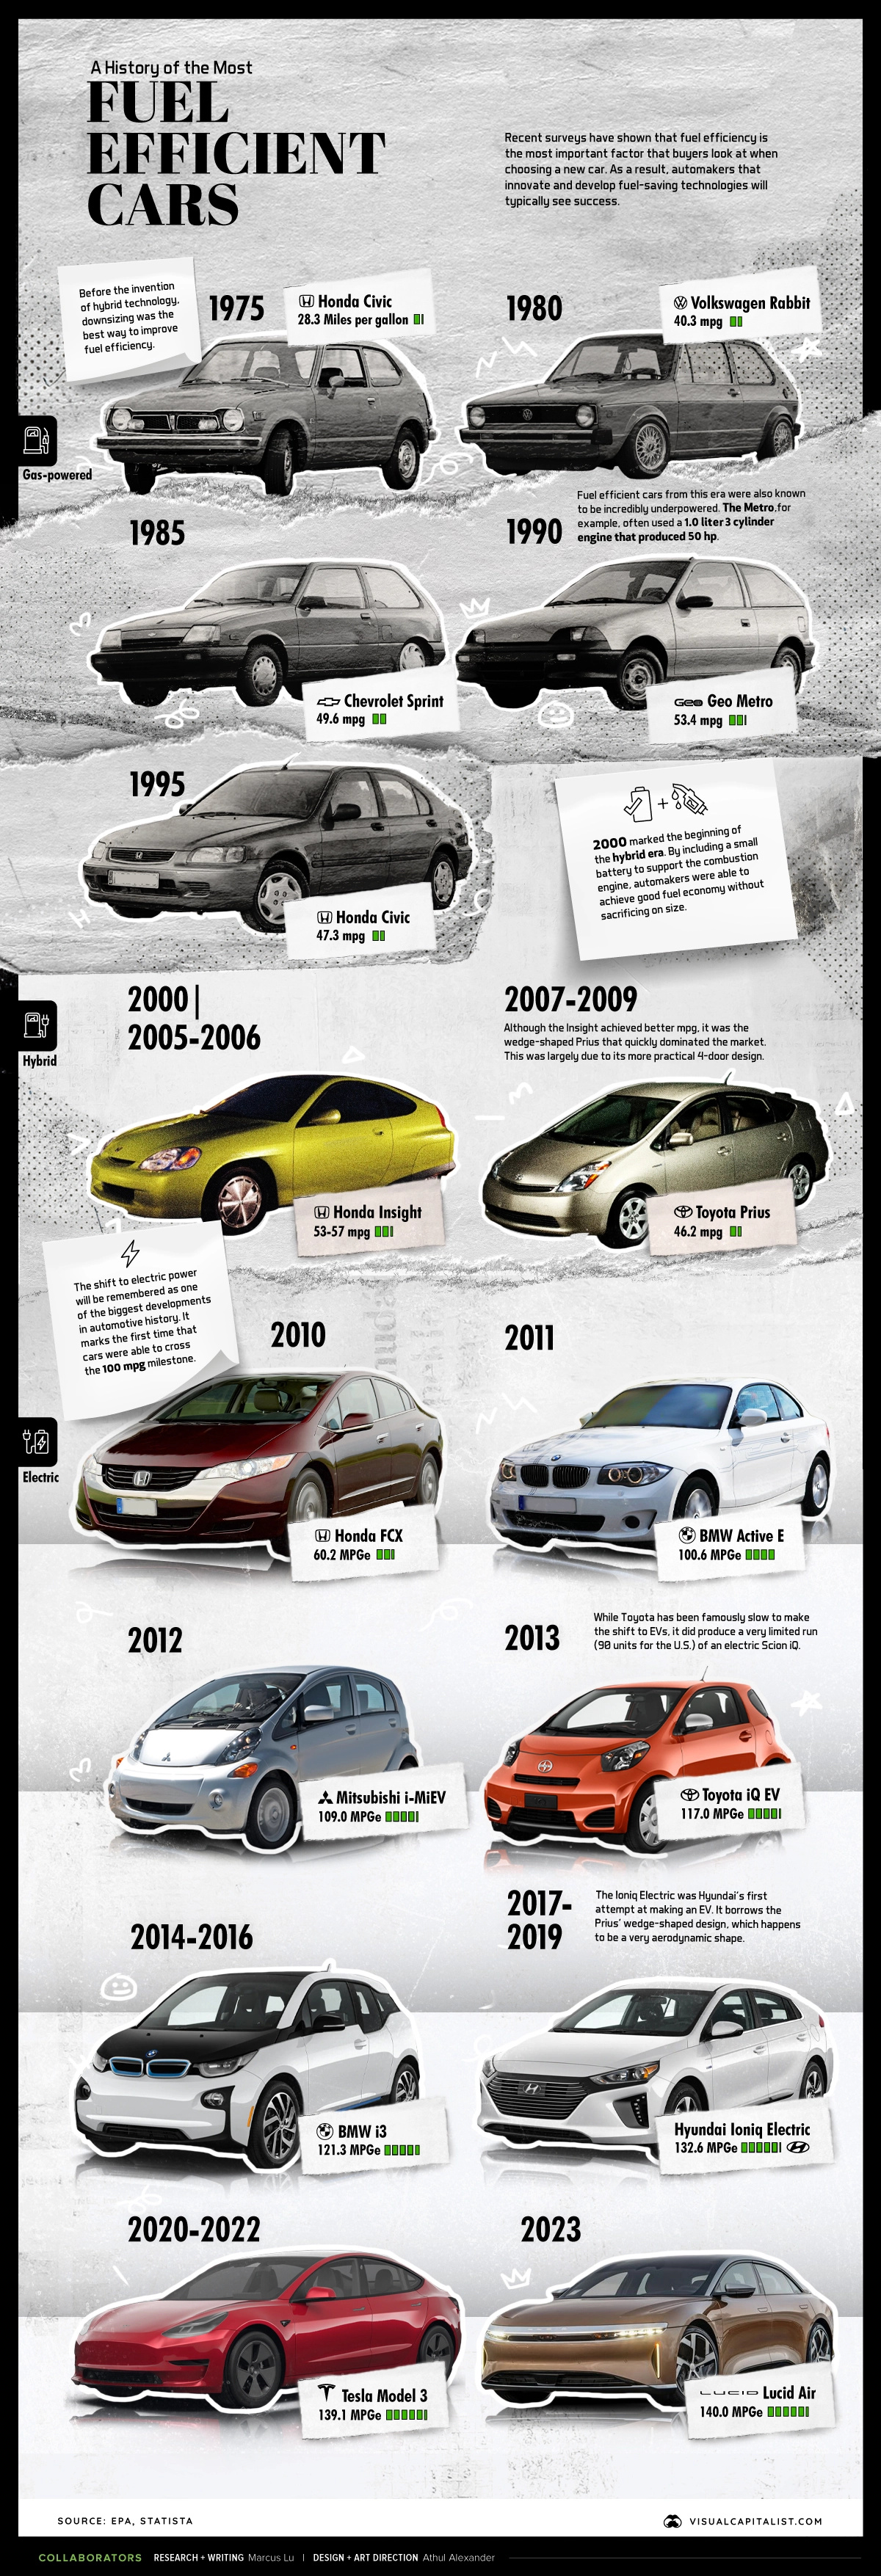
In this infographic, we’ve used data from the EPA’s 2022 Automotive Trends Report to list off the most fuel efficient cars from 1975 to today.
Editor’s note: This is from a U.S. government agency, so the data shown skews towards cars sold in North America.
Data Overview
All of the information in the above infographic is listed in the table below. Data was only available in 5-year increments up until 2005, after which it switches to annual.
| Model Year | Make | Model | Real World Fuel Economy (mpg) | Engine Type |
|---|---|---|---|---|
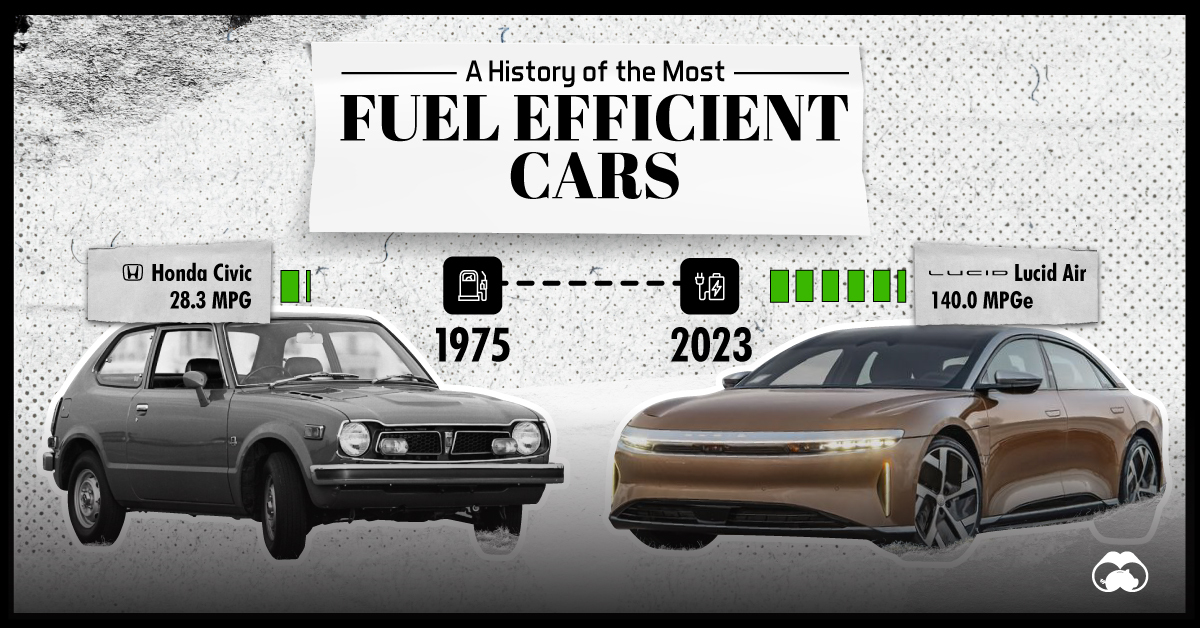
| 1975 | Honda | Civic | 28.3 | Gas |
| 1980 | VW | Rabbit | 40.3 | Diesel |
| 1985 | Chevrolet | Sprint | 49.6 | Gas |
| 1990 | Geo | Metro | 53.4 | Gas |
| 1995 | Honda | Civic | 47.3 | Gas |
| 2000 | Honda | Insight | 57.4 | Hybrid |
| 2005 | Honda | Insight | 53.3 | Hybrid |
| 2006 | Honda | Insight | 53 | Hybrid |
| 2007 | Toyota | Prius | 46.2 | Hybrid |
| 2008 | Toyota | Prius | 46.2 | Hybrid |
| 2009 | Toyota | Prius | 46.2 | Hybrid |
| 2010 | Honda | FCX | 60.2 | FCEV |
| 2011 | BMW | Active E | 100.6 | EV |
| 2012 | Mitsubishi | i-MiEV | 109 | EV |
| 2013 | Toyota | iQ EV | 117 | EV |
| 2014 | BMW | i3 | 121.3 | EV |
| 2015 | BMW | i3 | 121.3 | EV |
| 2016 | BMW | i3 | 121.3 | EV |
| 2017 | Hyundai | Ioniq Electric | 132.6 | EV |
| 2018 | Hyundai | Ioniq Electric | 132.6 | EV |
| 2019 | Hyundai | Ioniq Electric | 132.6 | EV |
| 2020 | Tesla | 3 | 138.6 | EV |
| 2021 | Tesla | 3 | 139.1 | EV |
From this dataset, we can identify three distinct approaches to maximizing fuel efficiency.
Downsizing
Prior to 2000, the best way for automakers to achieve good fuel efficiency was by downsizing. Making cars smaller (lighter) meant they could also be fitted with very small engines.
For example, the 1985 Chevrolet Sprint was rated at 49.6 MPG, but had a sluggish 0-60 time of 15 seconds.
Hybrids
The 2000s saw the introduction of mass-market hybrid vehicles like the Honda Insight and Toyota Prius. By including a small battery to support the combustion engine, automakers could achieve good MPGs without sacrificing so heavily on size.
While the Insight achieved better fuel economy than the Prius, it was the latter that became synonymous with the term “hybrid”. This was largely due to the Prius’ more practical 4-door design.
The following table compares annual U.S. sales figures for both models. Insight sales have fluctuated drastically because Honda has produced the model in several short spans (1999-2006, 2009-2014, 2018-2022).
| Year | Insight Sales | Prius Sales |
|---|---|---|
| 2005 | 666 | 107,155 |
| 2006 | 722 | 106,971 |
| 2007 | 3 | 181,221 |
| 2008 | - | 158,884 |
| 2009 | 20,572 | 150,831 |
| 2010 | 20,962 | 140,928 |
| 2011 | 15,549 | 136,464 |
| 2012 | 6,619 | 236,655 |
| 2013 | 4,802 | 234,228 |
| 2014 | 3,965 | 207,372 |
| 2015 | 1,458 | 184,794 |
| 2016 | 67 | 136,629 |
| 2017 | 3 | 108,661 |
| 2018 | 12,513 | 87,590 |
| 2019 | 23,686 | 69,718 |
| 2020 | 15,932 | 43,525 |
| 2021 | 18,685 | 59,010 |
| 2022 | 7,628 | 33,352 |
Source: goodcarbadcar.net
The Prius may have dominated the hybrid market for a long time, but it too has run into troubles. Sales have been declining since 2014, even setting historic lows in recent years.
There are several reasons behind this trend, with one being a wider availability of hybrid models from other brands. We also can’t ignore the release of the Tesla Model 3, which began shipping to customers in 2017.
Electric Vehicles
We’re currently in the middle of a historic transition to electric vehicles. However, because EVs do not use fuel, the EPA had to develop a new system called MPGe (miles per gallon of gasoline-equivalent).
This new metric gives us the ability to compare the efficiency of EVs with traditional gas-powered cars. An underlying assumption of MPGe is that 33.7 kilowatt-hours (kWh) of electricity is comparable to the energy content of a gallon of fuel.
The most fuel efficient car you can buy today is the 2023 Lucid Air, which achieves 140 MPGe. Close behind it is the 2023 Tesla Model 3 RWD, which is rated at 132 MPGe.
Check out this page to see the EPA’s top 10 most efficient vehicles for 2023.


Automotive
How People Get Around in America, Europe, and Asia
Examining how people get around using cars, public transit, and walking or biking, and the regional differences in usage.


How People Get Around in America, Europe, and Asia
This was originally posted on our Voronoi app. Download the app for free on iOS or Android and discover incredible data-driven charts from a variety of trusted sources.
This chart highlights the popularity of different transportation types in the Americas, Europe, and Asia, calculated by modal share.
Data for this article and visualization is sourced from ‘The ABC of Mobility’, a research paper by Rafael Prieto-Curiel (Complexity Science Hub) and Juan P. Ospina (EAFIT University), accessed through ScienceDirect.
The authors gathered their modal share data through travel surveys, which focused on the primary mode of transportation a person employs for each weekday trip. Information from 800 cities across 61 countries was collected for this study.
North American Car Culture Contrasts with the Rest of the World
In the U.S. and Canada, people heavily rely on cars to get around, no matter the size of the city. There are a few exceptions of course, such as New York, Toronto, and smaller college towns across the United States.
| Region | 🚗 Cars | 🚌 Public Transport | 🚶 Walking/Biking |
|---|---|---|---|
| North America* | 92% | 5% | 4% |
| Central America | 23% | 42% | 35% |
| South America | 29% | 40% | 31% |
| Northern Europe | 48% | 29% | 24% |
| Western Europe | 43% | 24% | 34% |
| Southern Europe | 50% | 24% | 25% |
| Eastern Europe | 35% | 40% | 25% |
| Southeastern Asia | 44% | 43% | 13% |
| Western Asia | 43% | 28% | 29% |
| Southern Asia | 22% | 39% | 39% |
| Eastern Asia | 19% | 46% | 35% |
| World | 51% | 26% | 22% |
Note: *Excluding Mexico. Percentages are rounded.
As a result, North America’s share of public transport and active mobility (walking and biking) is the lowest amongst all surveyed regions by a significant amount.
On the other hand, public transport reigns supreme in South and Central America as well as Southern and Eastern Asia. It ties with cars in Southeastern Asia, and is eclipsed by cars in Western Asia.
As outlined in the paper, Europe sees more city-level differences in transport popularity.
For example, Utrecht, Netherlands prefers walking and biking. People in Paris and London like using their extensive transit systems. And in Manchester and Rome, roughly two out of three journeys are by car.

-

 Markets5 days ago
Visualizing Global Inflation Forecasts (2024-2026)
-

 Green2 weeks ago
The Carbon Footprint of Major Travel Methods
-

 United States2 weeks ago
Visualizing the Most Common Pets in the U.S.
-

 Culture2 weeks ago
The World’s Top Media Franchises by All-Time Revenue
-

 voronoi1 week ago
Best Visualizations of April on the Voronoi App
-

 Wealth1 week ago
Charted: Which Country Has the Most Billionaires in 2024?
-

 Business1 week ago
The Top Private Equity Firms by Country
-

 Markets1 week ago
The Best U.S. Companies to Work for According to LinkedIn