Datastream
The Drive for a Fully Autonomous Car
The following content is sponsored by Global X ETFs
The Briefing
- SAE International, the global standards and engineering association, has come up with a six level taxonomy for automated cars.
- In 2021, 26 companies testing 1,174 autonomous vehicles (with a driver) logged over 4 million miles on California roads. Four companies logged only 25,000 miles using driverless vehicles.
Until quite recently, the autonomous car was the stuff of science fiction. More hype than happening some time soon.
But with automakers spending billions to develop the technology—$75 billion by one count—the race is on to be the first to launch a fully self-driving vehicle.
This visualization from our sponsor Global X ETFs, takes a look at the drive for a fully autonomous car.
From the Flintstones to the Jetsons
What does it mean to say that a car is autonomous? Does a human driver need to be ready to take over? Can it drive on its own all or just some of the time? And do driving conditions need to be ideal or can it handle the odd thunderstorm?
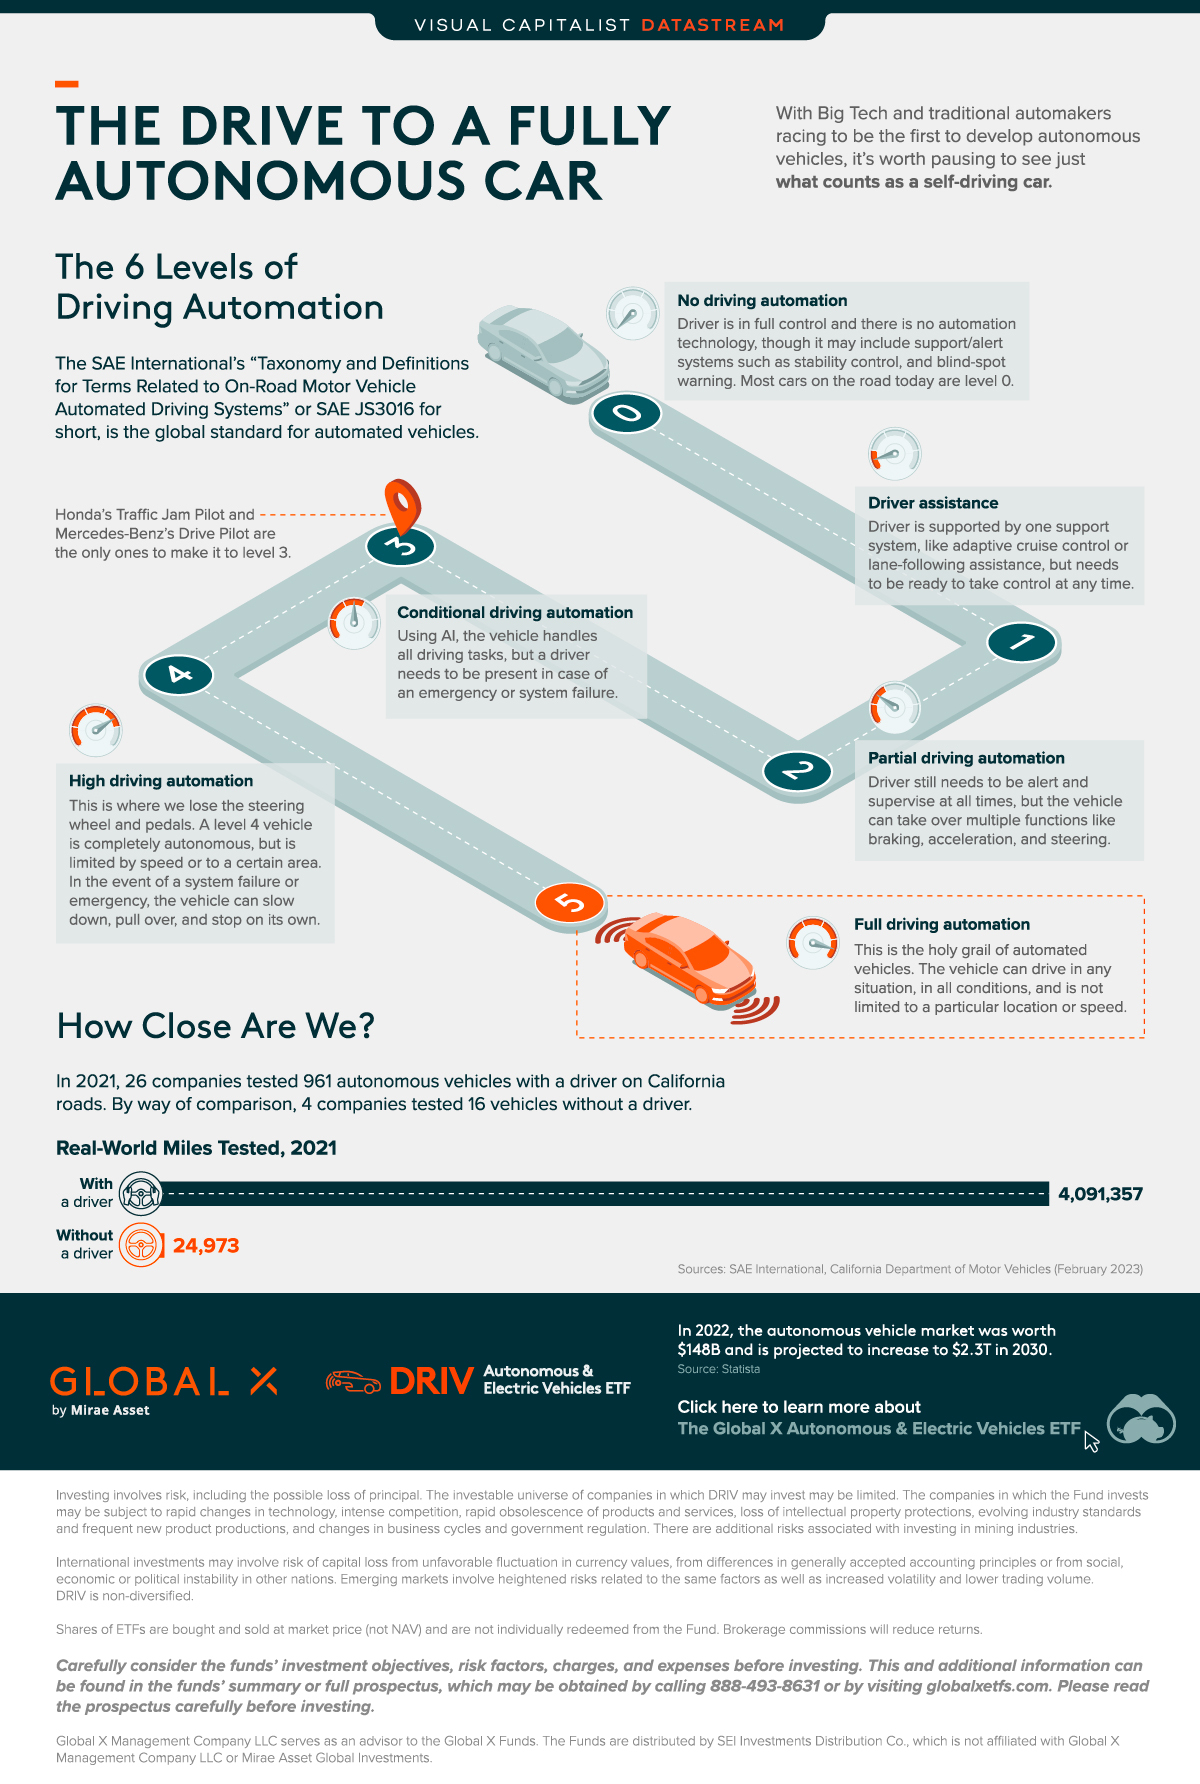
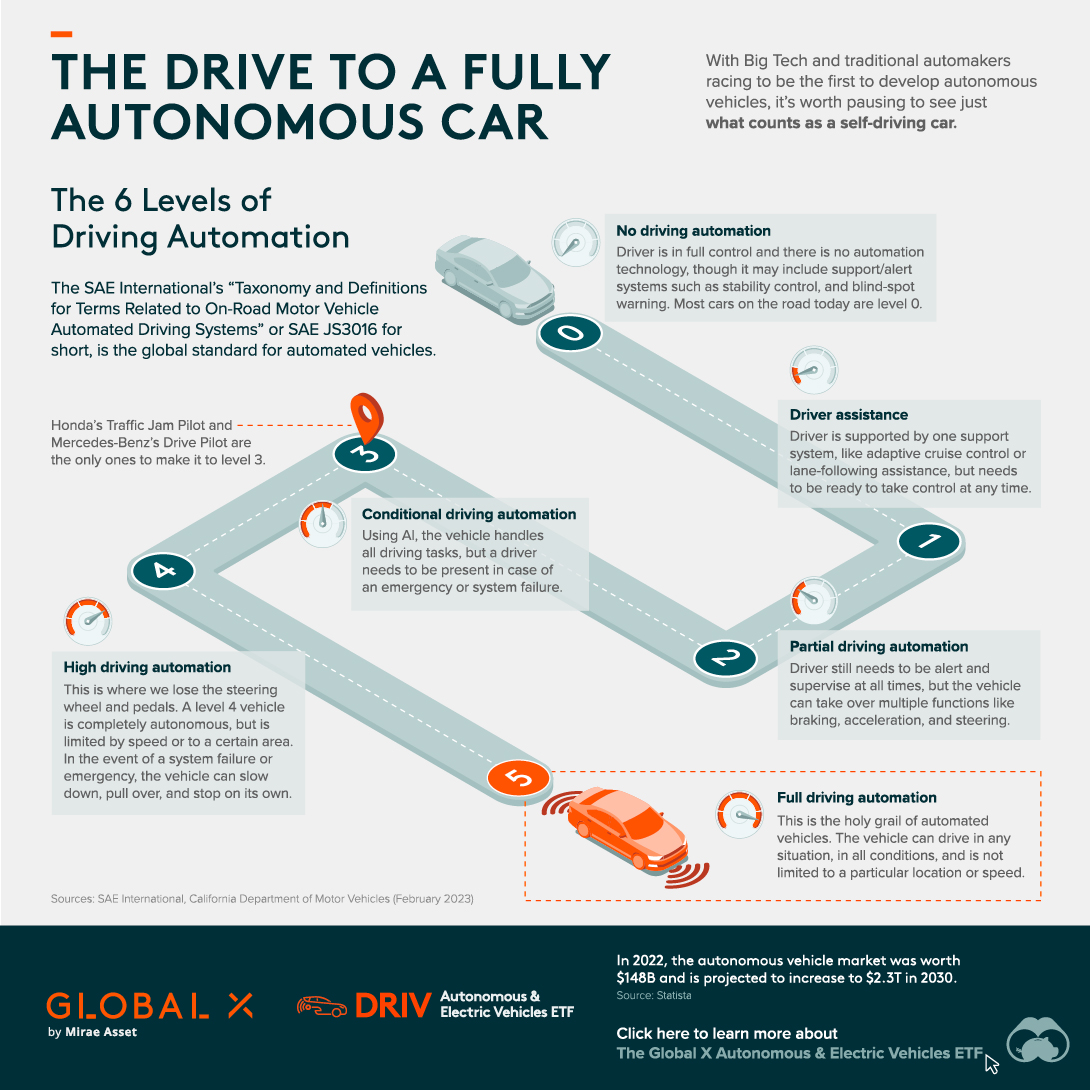
Fortunately, SAE International, the global standards and engineering association, has come up with the creatively-named “Taxonomy and Definitions for Terms Related to On-Road Motor Vehicle Automated Driving Systems,” or SAE JS3016 for short.
The Six Levels of Driving Automation
The system has six levels of automation and spans a yawning gulf of features. Level zero is analogous to Fred Flintstone’s foot-powered, stone age car, while level five is something like George Jetson’s futuristic, bubble-blowing flying saucer.
Level 0: No Driving Automation
The driver is in full control and there is no automation technology. It may include support or alert systems such as stability control and blind-spot warning. Most cars on the road today are level zero.
Level 1: Driver Assistance
The driver is supported by one support system, like adaptive cruise control or lane-following assistance, but needs to be ready to take control at any time.
Level 2: Partial Driving Automation
The driver still needs to be alert and supervise at all times, but the vehicle can take over multiple functions like braking, acceleration, and steering, using Advanced Driving Assistance Systems (ADAS). The Tesla Autopilot feature is generally understood to fall under level two.
Level 3: Conditional Driving Automation
After this point you are not considered to be driving, even if you’re seated in the driver’s seat. Using artificial intelligence (AI), the vehicle handles all driving tasks. A driver still needs to be present in case of an emergency or system failure. Honda’s Traffic Jam Pilot and Mercedes-Benz’s Drive Pilot are the only ones to hit this milestone.
Level 4: High Driving Automation
This is where you lose the steering wheel and pedals. A level four vehicle is completely autonomous, but is limited by speed or to a certain geographic area. In the event of a system failure or emergency, the vehicle can slow down, pull over, and stop on its own. A driverless taxi or public transport would be a likely application at this level.
Level 5: Full Driving Automation
This is the Holy Grail of automated vehicles. At this level, humans are completely superfluous and need only set the destination and sit back and enjoy the ride. The vehicle can drive in any situation, in all conditions, and is not limited to a particular location or speed.
So When Can I Watch Netflix While Driving?
Probably not anytime soon, if figures from California’s Department of Motor Vehicles are any indication.
The Pacific state is home to a host of autonomous vehicle manufacturers, many based in Silicon Valley, all eager to test their technology on public roadways. As a result, the DMV has developed regulations for testing self-driving cars, both with and without a driver.
Part of the rules require that manufacturers file annual reports about their activities. According to these, at the end of 2021, 26 companies testing 1,174 autonomous vehicles (with a driver) logged over 4 million miles on California roads. By way of comparison, four companies logged only 25,000 miles using driverless vehicles.
If you take the miles covered as a proxy for how far the technology has progressed, testing on systems that still require a driver—so level 3 at best—is miles ahead of driverless systems, or level 4 and up.
Hey Siri, Which Way Next?
In addition to being a really tough engineering problem, autonomous cars also raise tricky ethical questions.
Part of the difficulty has been trying to get a machine to make the same choices as human drivers would. What if the brakes fail and the AI has to make a split-second decision? Does it swerve to avoid a pedestrian and into a telephone pole, maybe killing the passenger, or keep driving?
Problems such as these are often covered in philosophy under the Trolley Problem, which features a runaway trolley and a switch. Throw the switch and save a life, but maybe take another?
Tackling this problem, which can get a bit absurd at times, is a good way to discover the “right” answer to ethical questions. Autonomous car manufacturers are going to have to have an answer in any autonomous future.
Invest in the Future of Road Transport
With autonomous car technology advancing at leaps and bounds, there are plenty of opportunities to invest in the companies working to make it a reality.
Learn more about the Global X Autonomous & Electric Vehicles ETF (DRIV), which provides exposure to companies involved in the development of autonomous vehicles, EVs, and EV components and materials.
You can also learn how experiential technologies like AI are driving change in road transport in Charting Disruption, a joint report by Global X ETFs and the Wall Street Journal (also available as a downloadable PDF).


Datastream
Can You Calculate Your Daily Carbon Footprint?
Discover how the average person’s carbon footprint impacts the environment and learn how carbon credits can offset your carbon footprint.


The Briefing
- A person’s carbon footprint is substantial, with activities such as food consumption creating as much as 4,500 g of CO₂ emissions daily.
- By purchasing carbon credits from Carbon Streaming Corporation, you can offset your own emissions and fund positive climate action.
Your Everyday Carbon Footprint
While many large businesses and countries have committed to net-zero goals, it is essential to acknowledge that your everyday activities also contribute to global emissions.
In this graphic, sponsored by Carbon Streaming Corporation, we will explore how the choices we make and the products we use have a profound impact on our carbon footprint.
Carbon Emissions by Activity
Here are some of the daily activities and products of the average person and their carbon footprint, according to Clever Carbon.
| Household Activities & Products | CO2 Emissions (g) |
|---|---|
| 💡 Standard Light Bulb (100 watts, four hours) | 172 g |
| 📱 Mobile Phone Use (195 minutes per day)* | 189 g |
| 👕 Washing Machine (0.63 kWh) | 275 g |
| 🔥 Electric Oven (1.56 kWh) | 675 g |
| ♨️ Tumble Dryer (2.5 kWh) | 1,000 g |
| 🧻 Toilet Roll (2 ply) | 1,300 g |
| 🚿 Hot Shower (10 mins) | 2,000 g |
| 🚙 Daily Commute (one hour, by car) | 3,360 g |
| 🍽️ Average Daily Food Consumption (three meals of 600 calories) | 4,500 g |
| *Phone use based on yearly use of 69kg per the source, Reboxed | |
Your choice of transportation plays a crucial role in determining your carbon footprint. For instance, a 15 km daily commute to work on public transport generates an average of 1,464 g of CO₂ emissions. Compared to 3,360 g—twice the volume for a journey the same length by car.
By opting for more sustainable modes of transport, such as cycling, walking, or public transportation, you can significantly reduce your carbon footprint.
Addressing Your Carbon Footprint
One way to compensate for your emissions is by purchasing high-quality carbon credits.
Carbon credits are used to help fund projects that avoid, reduce or remove CO₂ emissions. This includes nature-based solutions such as reforestation and improved forest management, or technology-based solutions such as the production of biochar and carbon capture and storage (CCS).
While carbon credits offer a potential solution for individuals to help reduce global emissions, public awareness remains a significant challenge. A BCG-Patch survey revealed that only 34% of U.S. consumers are familiar with carbon credits, and only 3% have purchased them in the past.
About Carbon Streaming
By financing the creation or expansion of carbon projects, Carbon Streaming Corporation secures the rights to future carbon credits generated by these sustainable projects. You can then purchase these carbon credits to help fund climate solutions around the world and compensate for your own emissions.
Ready to get involved?
>> Learn more about purchasing carbon credits at Carbon Streaming

-

 Brands6 days ago
How Tech Logos Have Evolved Over Time
-

 Demographics2 weeks ago
The Smallest Gender Wage Gaps in OECD Countries
-

 Economy2 weeks ago
Where U.S. Inflation Hit the Hardest in March 2024
-

 Green2 weeks ago
Top Countries By Forest Growth Since 2001
-

 United States2 weeks ago
Ranked: The Largest U.S. Corporations by Number of Employees
-

 Maps2 weeks ago
The Largest Earthquakes in the New York Area (1970-2024)
-

 Green2 weeks ago
Ranked: The Countries With the Most Air Pollution in 2023
-

 Green2 weeks ago
Ranking the Top 15 Countries by Carbon Tax Revenue