Technology
The Changing Landscape of Business Risk
View a high resolution version of this graphic
The Changing Landscape of Business Risk
View the high resolution version of today’s graphic by clicking here.
In the modern era, the pace of business is fast – but the pace of technological change is even faster.
As a result, the landscape of business risks is constantly shifting and changing, and both entrepreneurs and investors need to be on top of the potential factors that could disrupt their chances of success. At the same time, they also need to be prepared to address and mitigate new risks as they crop up.
Today’s Biggest Risks
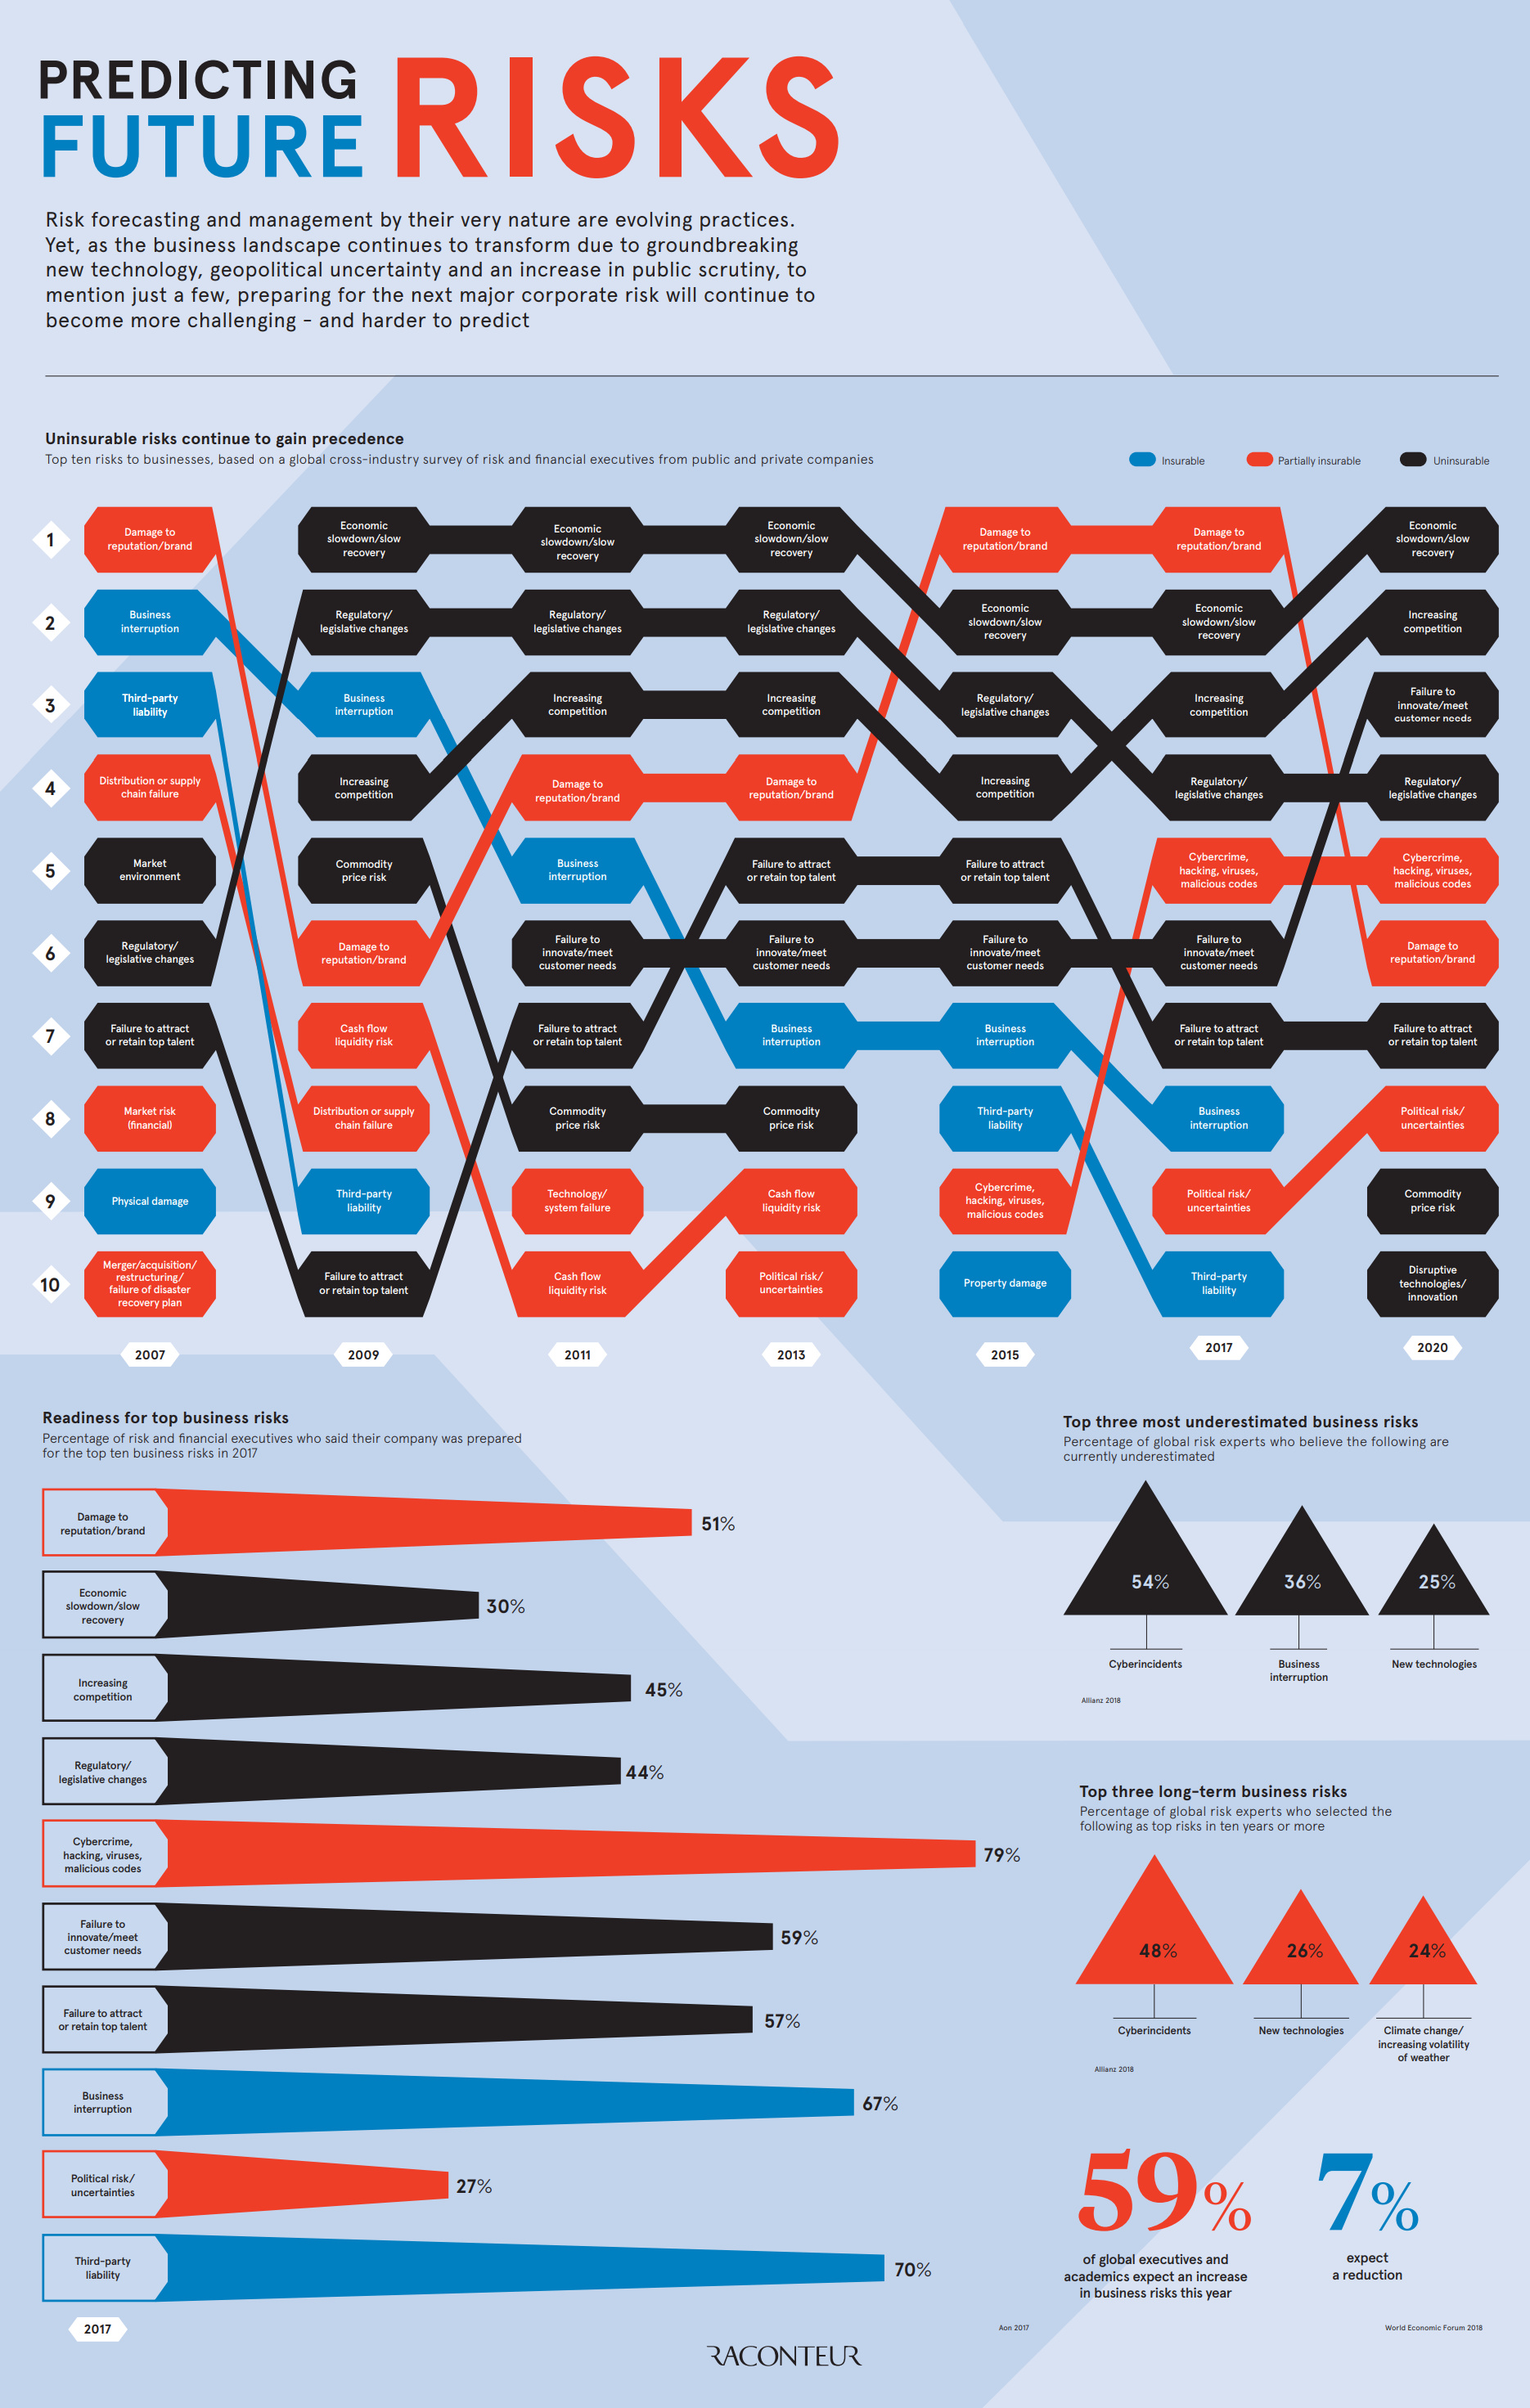
Today’s infographic comes to us from Raconteur, and it highlights the forces that have been shaping the business risk landscape – both today and as projected for the future.
Using data from the 2017 Global Risk Management Survey done by insurance company Aon, it shows the top business risks according to 1,843 risk decision-makers from 33 industry sectors in over 60 countries.
Here were the top risks from 2017, as well as the corresponding portion of business leaders that said they were prepared for each risk:
| Rank (2017) | Business Risk | Readiness |
|---|---|---|
| #1 | Damage to reputation/brand | 51% |
| #2 | Economic slowdown/slow recovery | 30% |
| #3 | Increasing competition | 45% |
| #4 | Regulatory/legislative changes | 44% |
| #5 | Cybercrime, hacking, viruses, malicious codes | 79% |
| #6 | Failure to innovate/meet customer needs | 59% |
| #7 | Failure to attract or retain talent | 57% |
| #8 | Business interruption | 67% |
| #9 | Political risk/uncertainties | 27% |
| #10 | Third-party liability | 70% |
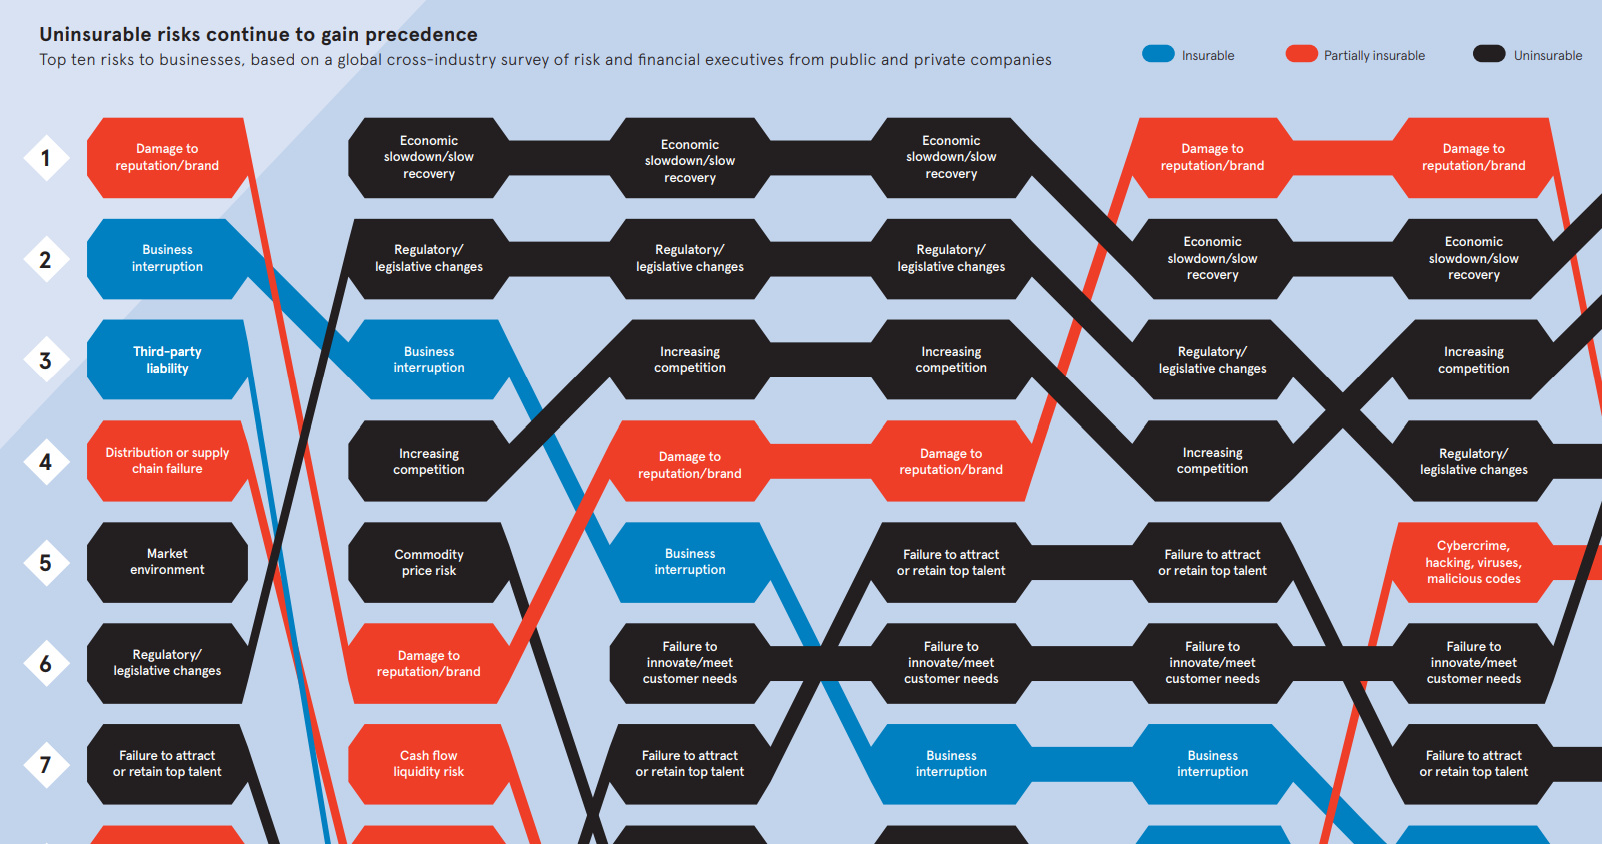
The insurer noted that many of these top business risks were uninsurable – and that in general, that such risks are continuing to gain precedence.
Future Business Risk
Interestingly, the survey also asked respondents to predict the risks in 2020 based on current trends and conditions.
Here is the same list, but for 2020, including the current ranks as well:
| Rank (2020) | Business Risk | Previous Rank (2017) |
|---|---|---|
| #1 | Economic slowdown/slow recovery | 2 |
| #2 | Increasing competition | 3 |
| #3 | Failure to innovate/meet customer needs | 6 |
| #4 | Regulatory/legislative changes | 4 |
| #5 | Cybercrime, hacking, viruses, malicious codes | 5 |
| #6 | Damage to reputation/brand | 1 |
| #7 | Failure to attract or retain talent | 7 |
| #8 | Political risk/uncertainties | 9 |
| #9 | Commodity price risk | n/a |
| #10 | Disruptive technologies/innovation | n/a |
Damage to risk/brand fell out of the top spot all the way to #6, and two new entrants appear for the first time: commodity price risk and disruptive technology/innovation.
Cybercrime Overconfidence
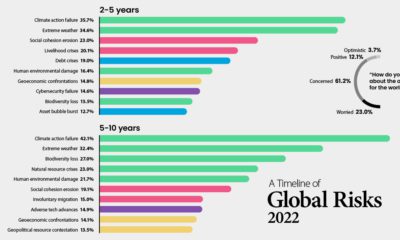
Raconteur’s infographic also points to the biggest long-term risks to business, and the risks that get the most underestimated. These both come from a 2018 report by German asset manager Allianz, which includes opinions from a selection of risk experts.
The Biggest Long Term Risks
1. Cyberincidents
2. New technologies
3. Climate change/increasing volatility of weather
The Most Underestimated Risks
1. Cyberincidents
2. Business interruption
3. New technologies
As you’ll notice, the risk of “cyberincidents” tops both lists.
This is particularly interesting, because in the previous survey of business leaders, the potential business risk of “cybercrime, hacking, viruses, and malicious codes” was the one that leaders said they were most prepared for, with a 79% readiness level.
Yet, cyberincidents – which have an estimated annual impact of $450 billion per year – are both the top long-term risk and the most underestimated risk according to risk experts in the Allianz report.
Could business leaders be overconfident about this kind of threat?


Technology
Visualizing AI Patents by Country
See which countries have been granted the most AI patents each year, from 2012 to 2022.


Visualizing AI Patents by Country
This was originally posted on our Voronoi app. Download the app for free on iOS or Android and discover incredible data-driven charts from a variety of trusted sources.
This infographic shows the number of AI-related patents granted each year from 2010 to 2022 (latest data available). These figures come from the Center for Security and Emerging Technology (CSET), accessed via Stanford University’s 2024 AI Index Report.
From this data, we can see that China first overtook the U.S. in 2013. Since then, the country has seen enormous growth in the number of AI patents granted each year.
| Year | China | EU and UK | U.S. | RoW | Global Total |
|---|---|---|---|---|---|
| 2010 | 307 | 137 | 984 | 571 | 1,999 |
| 2011 | 516 | 129 | 980 | 581 | 2,206 |
| 2012 | 926 | 112 | 950 | 660 | 2,648 |
| 2013 | 1,035 | 91 | 970 | 627 | 2,723 |
| 2014 | 1,278 | 97 | 1,078 | 667 | 3,120 |
| 2015 | 1,721 | 110 | 1,135 | 539 | 3,505 |
| 2016 | 1,621 | 128 | 1,298 | 714 | 3,761 |
| 2017 | 2,428 | 144 | 1,489 | 1,075 | 5,136 |
| 2018 | 4,741 | 155 | 1,674 | 1,574 | 8,144 |
| 2019 | 9,530 | 322 | 3,211 | 2,720 | 15,783 |
| 2020 | 13,071 | 406 | 5,441 | 4,455 | 23,373 |
| 2021 | 21,907 | 623 | 8,219 | 7,519 | 38,268 |
| 2022 | 35,315 | 1,173 | 12,077 | 13,699 | 62,264 |
In 2022, China was granted more patents than every other country combined.
While this suggests that the country is very active in researching the field of artificial intelligence, it doesn’t necessarily mean that China is the farthest in terms of capability.
Key Facts About AI Patents
According to CSET, AI patents relate to mathematical relationships and algorithms, which are considered abstract ideas under patent law. They can also have different meaning, depending on where they are filed.
In the U.S., AI patenting is concentrated amongst large companies including IBM, Microsoft, and Google. On the other hand, AI patenting in China is more distributed across government organizations, universities, and tech firms (e.g. Tencent).
In terms of focus area, China’s patents are typically related to computer vision, a field of AI that enables computers and systems to interpret visual data and inputs. Meanwhile America’s efforts are more evenly distributed across research fields.
Learn More About AI From Visual Capitalist
If you want to see more data visualizations on artificial intelligence, check out this graphic that shows which job departments will be impacted by AI the most.

-

 Mining1 week ago
Gold vs. S&P 500: Which Has Grown More Over Five Years?
-

 Markets2 weeks ago
Ranked: The Most Valuable Housing Markets in America
-

 Money2 weeks ago
Which States Have the Highest Minimum Wage in America?
-

 AI2 weeks ago
Ranked: Semiconductor Companies by Industry Revenue Share
-

 Markets2 weeks ago
Ranked: The World’s Top Flight Routes, by Revenue
-

 Countries2 weeks ago
Population Projections: The World’s 6 Largest Countries in 2075
-

 Markets2 weeks ago
The Top 10 States by Real GDP Growth in 2023
-

 Demographics2 weeks ago
The Smallest Gender Wage Gaps in OECD Countries