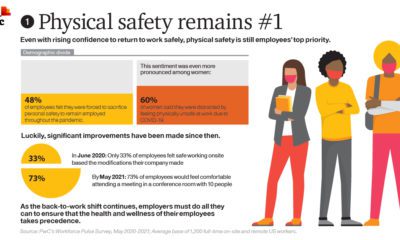

The pandemic has put the workforce through the wringer. This year-long survey highlights the four biggest back-to-work priorities and challenges that must be addressed.


This infographic examines trends in each generation's media consumption to see how Americans adapted during the pandemic.
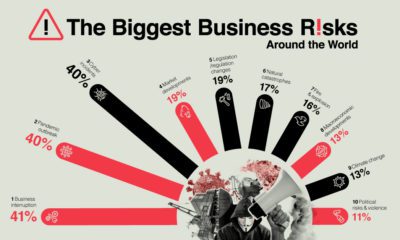

We live in an increasingly volatile world, where change is the only constant. Which are the top ten business risks to watch out for?
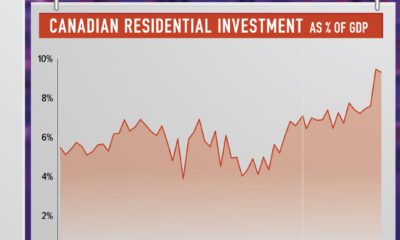

Canada's housing market is booming. Residential real estate investment currently makes up 9.4% of the country's GDP, more than ever before.
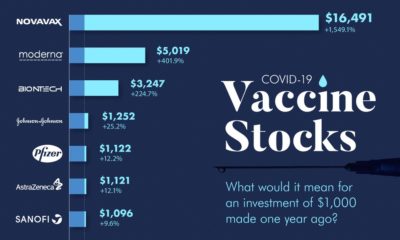

Ever wonder what you would have gotten if you invested $1,000 into the different vaccine stocks at the start of the pandemic?
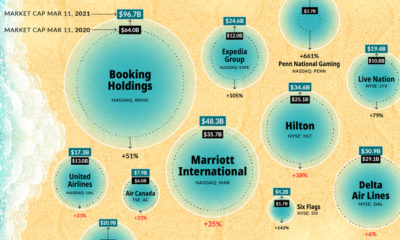

BEACH stocks—bookings, entertainment, airlines, cruises, and hotels—were pulverized at the beginning of the pandemic. Here's how they've bounced back.
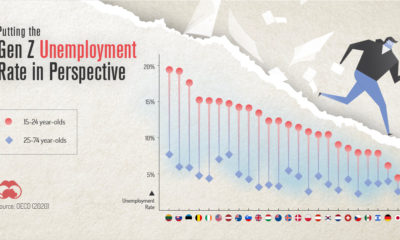

COVID-19 has impacted everyone, but one generation is taking it harder than the others. This graphic reveals the Gen Z unemployment rate.
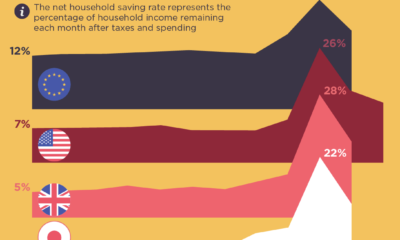

Were people more frugal during the pandemic or did they break the bank? This visual assesses the saving rates across different countries.
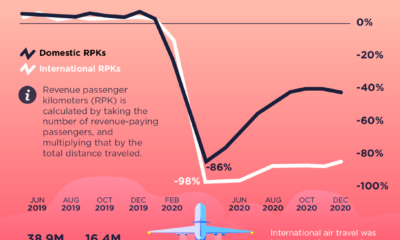

In spring 2020, roughly two-thirds of the world's passenger jets were grounded. Here's how things have rebounded since the onset of the pandemic.
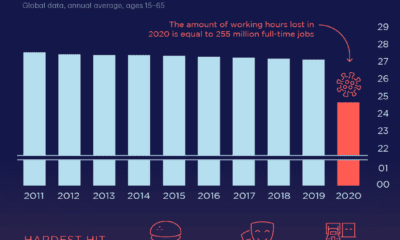

The pandemic has impacted employment greatly. This visual reveals how its effects have led to losses in hours worked by global workers in 2020.


