Datastream
One Year In: How the Pandemic Impacted Employment Around the World


The Briefing
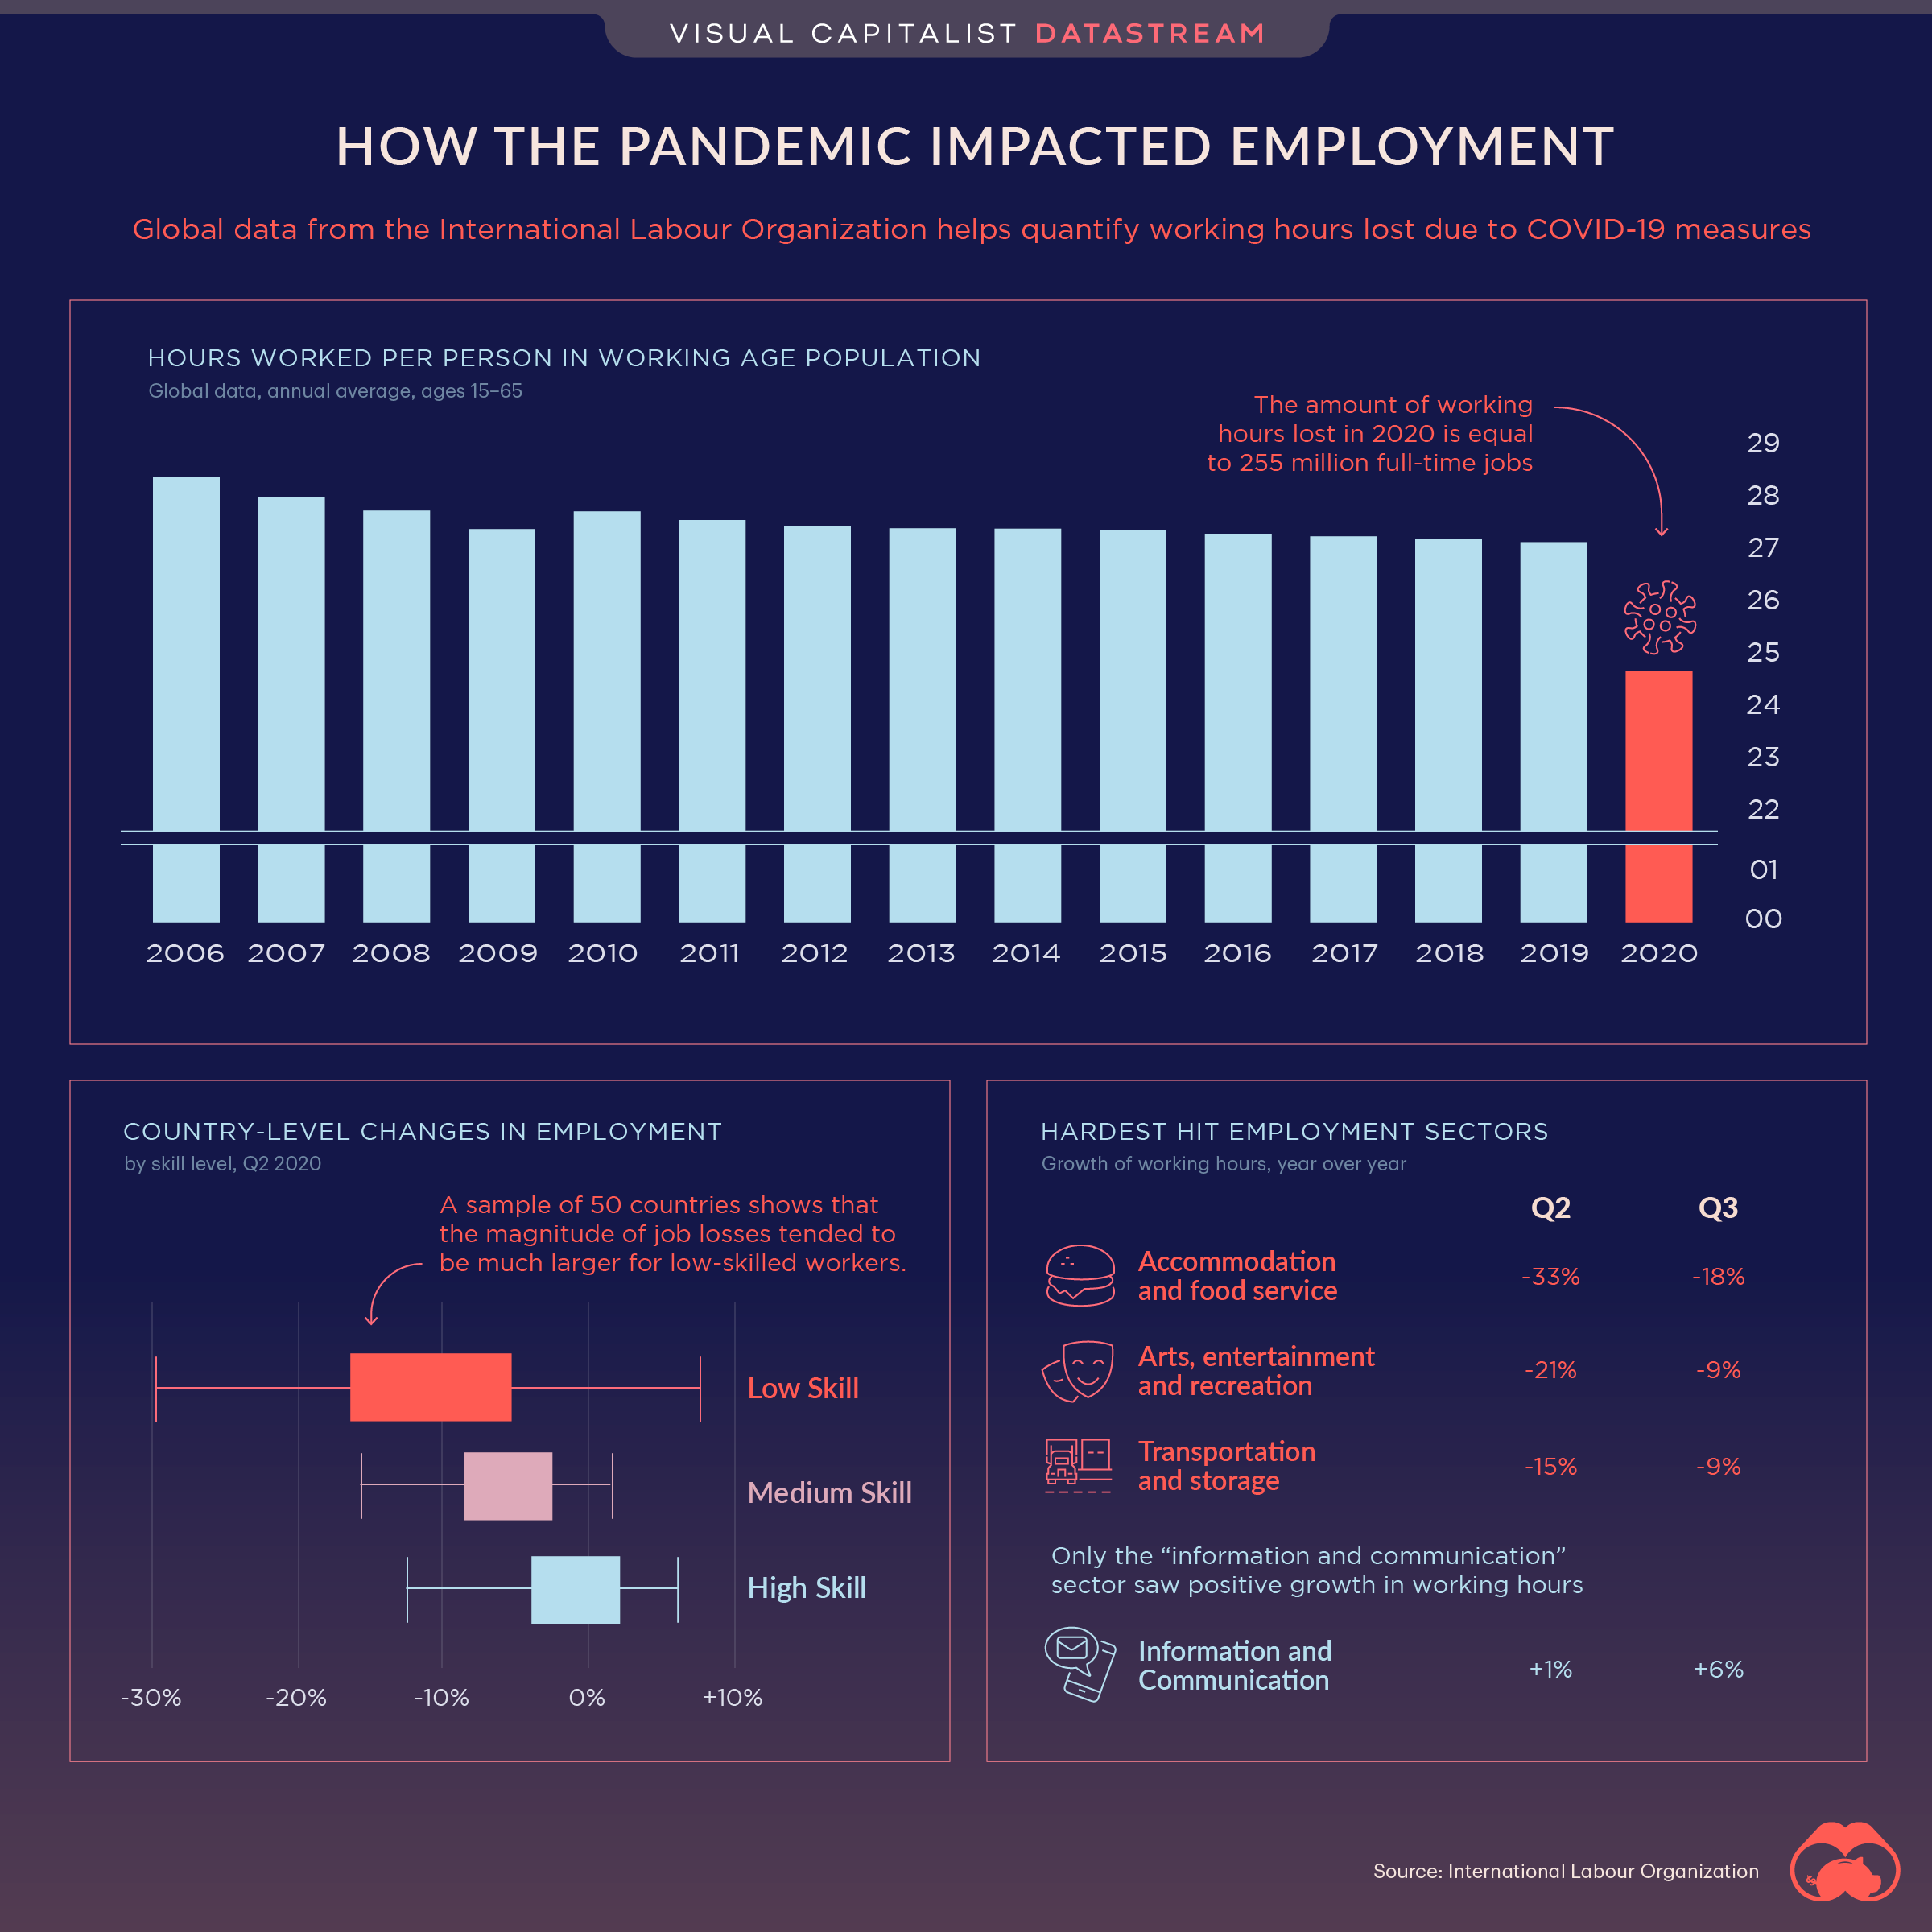
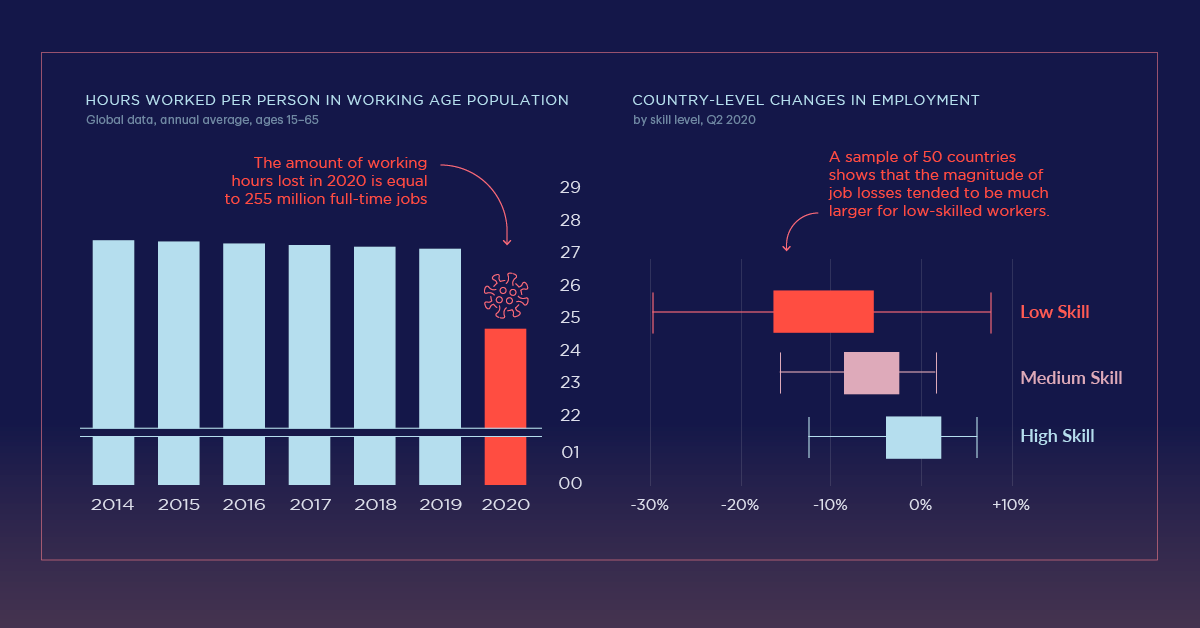
- The global pandemic had a significant impact on average working hours across the globe
- In 2020, 8.8% of global working hours were lost compared to Q4’2019
- The amount of working hours lost in 2020 is equal to 255 million full-time jobs
How the Pandemic Impacted Employment Around the World
One year in, the global pandemic has impacted employment and changed the nature of work in a multitude of ways.
As job loss rose across the globe, many countries introduced job retention schemes to steady unemployment rates. At the same time, working hours for many who held on to their jobs were reduced.
To put it in perspective, COVID-19’s negative impact on working hours globally has been around 4x more than that caused by the Global Financial Crisis in 2009.
Working Hard or Hardly Working?
As of January 2021, an estimated 93% of the world’s workforce lives in a country with some type of workplace closure restrictions still in place.
While profits were slashed across many industries, a majority of companies actually avoided firing people. However, 64% of firms either reduced wages, hours, or furloughed workers temporarily.
Compared to Q4’2019, total global working hours were reduced 8.8% in 2020. This is equivalent to approximately 255 million jobs.
Here’s a look at the working hour losses in a number of different countries.
| Country | 2020 Work Hour Losses Compared to Q4'2019 |
|---|---|
| Peru | 27.5% |
| Honduras | 24.3% |
| Panama | 23.5% |
| Argentina | 21.0% |
| Colombia | 20.9% |
| Bolivia | 20.5% |
| El Salvador | 19.4% |
| Ecuador | 17.6% |
| Costa Rica | 17.5% |
| Nepal | 17.4% |
| Armenia | 16.8% |
| Chile | 16.7% |
| Guatemala | 16.4% |
| Kuwait | 16.4% |
| Dominican Republic | 15.5% |
| Brazil | 14.9% |
| Bahamas | 14.8% |
| Eritrea | 14.7% |
| Turkey | 14.7% |
| Cyprus | 14.6% |
| Azerbaijan | 14.1% |
| Morocco | 14.1% |
| North Macedonia | 13.8% |
| India | 13.7% |
| Venezuela | 13.7% |
| Philippines | 13.6% |
| South Africa | 13.6% |
| Italy | 13.5% |
| Myanmar | 13.4% |
| Portugal | 13.4% |
| Cape Verde | 13.3% |
| Spain | 13.2% |
| Georgia | 13.1% |
| Oman | 13.1% |
| United States Virgin Islands | 13.0% |
| Moldova | 12.9% |
| Slovakia | 12.8% |
| United Kingdom | 12.8% |
| Greece | 12.6% |
| Cuba | 12.5% |
| Guyana | 12.5% |
| Ireland | 12.5% |
| Mexico | 12.5% |
| Bangladesh | 12.2% |
| Uganda | 12.2% |
| Bhutan | 11.9% |
| Suriname | 11.8% |
| Kyrgyzstan | 11.7% |
| Algeria | 11.6% |
| Kazakhstan | 11.5% |
| Maldives | 11.4% |
| Paraguay | 11.4% |
| Jamaica | 11.3% |
| Trinidad and Tobago | 11.3% |
| Uruguay | 11.2% |
| Belize | 11.1% |
| Malaysia | 11.1% |
| Iraq | 10.8% |
| Malta | 10.6% |
| Austria | 10.5% |
| Barbados | 10.4% |
| Jordan | 10.4% |
| Lebanon | 10.3% |
| Eswatini | 9.9% |
| Sri Lanka | 9.9% |
| Saint Lucia | 9.8% |
| Bosnia and Herzegovina | 9.7% |
| Guam | 9.6% |
| Egypt | 9.5% |
| Ethiopia | 9.5% |
| Kenya | 9.5% |
| Qatar | 9.5% |
| Rwanda | 9.4% |
| Canada | 9.3% |
| Congo | 9.3% |
| Libya | 9.3% |
| Saint Vincent and the Grenadines | 9.3% |
| United Arab Emirates | 9.3% |
| Israel | 9.2% |
| Pakistan | 9.2% |
| United States | 9.2% |
| Sudan | 9.1% |
| Zimbabwe | 9.1% |
| Bahrain | 9.0% |
| Liberia | 9.0% |
| Guinea-Bissau | 8.9% |
| Nigeria | 8.9% |
| Sao Tome and Principe | 8.9% |
| Romania | 8.8% |
| Ukraine | 8.8% |
| South Sudan | 8.7% |
| Angola | 8.6% |
| Hong Kong | 8.6% |
| Puerto Rico | 8.6% |
| Equatorial Guinea | 8.5% |
| Russia | 8.5% |
| Uzbekistan | 8.5% |
| Chad | 8.4% |
| France | 8.4% |
| Gabon | 8.3% |
| Saudi Arabia | 8.3% |
| Indonesia | 8.2% |
| Western Sahara | 8.2% |
| Slovenia | 8.0% |
| Montenegro | 7.8% |
| Singapore | 7.8% |
| Syria | 7.8% |
| Gambia | 7.7% |
| Guinea | 7.6% |
| Haiti | 7.6% |
| Serbia | 7.5% |
| Lesotho | 7.4% |
| Tonga | 7.4% |
| Belgium | 7.3% |
| Comoros | 7.1% |
| Madagascar | 6.9% |
| Djibouti | 6.8% |
| Mauritius | 6.7% |
| Democratic Republic of the Congo | 6.6% |
| Afghanistan | 6.5% |
| Botswana | 6.4% |
| Fiji | 6.3% |
| Germany | 6.3% |
| Iceland | 6.3% |
| Senegal | 6.3% |
| Lithuania | 6.1% |
| Bulgaria | 6.0% |
| Tunisia | 6.0% |
| Channel Islands | 5.9% |
| Iran | 5.9% |
| Namibia | 5.9% |
| French Polynesia | 5.7% |
| Croatia | 5.5% |
| Japan | 5.4% |
| Mauritania | 5.3% |
| Vanuatu | 5.3% |
| Hungary | 5.2% |
| Mozambique | 5.2% |
| Sweden | 5.2% |
| Vietnam | 5.2% |
| Malawi | 5.1% |
| Central African Republic | 5.0% |
| Togo | 4.9% |
| Cambodia | 4.8% |
| Samoa | 4.8% |
| Australia | 4.7% |
| Ghana | 4.7% |
| Estonia | 4.5% |
| Thailand | 4.5% |
| Brunei Darussalam | 4.4% |
| North Korea | 4.4% |
| Czech Republic | 4.3% |
| Laos | 4.3% |
| Netherlands | 4.3% |
| Cameroon | 4.2% |
| Côte d'Ivoire | 4.2% |
| China | 4.1% |
| Albania | 3.9% |
| Taiwan | 3.9% |
| Sierra Leone | 3.8% |
| Switzerland | 3.8% |
| Turkmenistan | 3.8% |
| South Korea | 3.7% |
| Luxembourg | 3.7% |
| Nicaragua | 3.7% |
| New Caledonia | 3.5% |
| Poland | 3.5% |
| Denmark | 3.3% |
| Latvia | 3.3% |
| Mali | 3.3% |
| Benin | 3.2% |
| Tajikistan | 3.2% |
| Timor-Leste | 2.7% |
| Burkina Faso | 2.6% |
| Zambia | 2.6% |
| Mongolia | 2.5% |
| Norway | 2.5% |
| Somalia | 2.5% |
| Macau | 1.9% |
| Papua New Guinea | 1.8% |
| Solomon Islands | 1.8% |
| Tanzania | 1.8% |
| Belarus | 1.3% |
| Finland | 1.3% |
| Yemen | 1.3% |
| Niger | 1.1% |
| New Zealand | 0.8% |
| Burundi | -0.1% |
The loss of working hours has impacted Southern Europe, South Asia, the Americas, and the Caribbean most significantly. Not surprisingly, these regions are all heavily reliant on tourism and hospitality to fuel their economies.
Job Losses and the Future of Work
Working hour losses, however, do not just come from reductions in hours. The ILO approximates that the blame for working hour losses can be shared equally, with around half due to job losses and half due to a reduction in working hours.
Worldwide employment losses in 2020 were equal to 114 million jobs.
However, a large number of people have notably been deemed ‘inactive,’ rather than unemployed, reducing the global labor force participation rate overall.
Although a rebound in working hours and jobs is expected in 2021, the pandemic’s effects on how we work, and the kinds jobs that are available will have a deeper long-term effect on the global labor force participation.
» Want to learn more? Check out our COVID-19 information hub to help put the past year into perspective
Where does this data come from?
Source: ILO
Details: The source defines workers as individuals aged 15-64. Full time jobs are defined using a 40 hour or 48 hour work week depending on the country. Additionally, the ILO used a multitude of national data sources on unemployment, furlough schemes, etc. to calculate working hour losses. Their methodology can be explored further here.


Datastream
Can You Calculate Your Daily Carbon Footprint?
Discover how the average person’s carbon footprint impacts the environment and learn how carbon credits can offset your carbon footprint.


The Briefing
- A person’s carbon footprint is substantial, with activities such as food consumption creating as much as 4,500 g of CO₂ emissions daily.
- By purchasing carbon credits from Carbon Streaming Corporation, you can offset your own emissions and fund positive climate action.
Your Everyday Carbon Footprint
While many large businesses and countries have committed to net-zero goals, it is essential to acknowledge that your everyday activities also contribute to global emissions.
In this graphic, sponsored by Carbon Streaming Corporation, we will explore how the choices we make and the products we use have a profound impact on our carbon footprint.
Carbon Emissions by Activity
Here are some of the daily activities and products of the average person and their carbon footprint, according to Clever Carbon.
| Household Activities & Products | CO2 Emissions (g) |
|---|---|
| 💡 Standard Light Bulb (100 watts, four hours) | 172 g |
| 📱 Mobile Phone Use (195 minutes per day)* | 189 g |
| 👕 Washing Machine (0.63 kWh) | 275 g |
| 🔥 Electric Oven (1.56 kWh) | 675 g |
| ♨️ Tumble Dryer (2.5 kWh) | 1,000 g |
| 🧻 Toilet Roll (2 ply) | 1,300 g |
| 🚿 Hot Shower (10 mins) | 2,000 g |
| 🚙 Daily Commute (one hour, by car) | 3,360 g |
| 🍽️ Average Daily Food Consumption (three meals of 600 calories) | 4,500 g |
| *Phone use based on yearly use of 69kg per the source, Reboxed | |
Your choice of transportation plays a crucial role in determining your carbon footprint. For instance, a 15 km daily commute to work on public transport generates an average of 1,464 g of CO₂ emissions. Compared to 3,360 g—twice the volume for a journey the same length by car.
By opting for more sustainable modes of transport, such as cycling, walking, or public transportation, you can significantly reduce your carbon footprint.
Addressing Your Carbon Footprint
One way to compensate for your emissions is by purchasing high-quality carbon credits.
Carbon credits are used to help fund projects that avoid, reduce or remove CO₂ emissions. This includes nature-based solutions such as reforestation and improved forest management, or technology-based solutions such as the production of biochar and carbon capture and storage (CCS).
While carbon credits offer a potential solution for individuals to help reduce global emissions, public awareness remains a significant challenge. A BCG-Patch survey revealed that only 34% of U.S. consumers are familiar with carbon credits, and only 3% have purchased them in the past.
About Carbon Streaming
By financing the creation or expansion of carbon projects, Carbon Streaming Corporation secures the rights to future carbon credits generated by these sustainable projects. You can then purchase these carbon credits to help fund climate solutions around the world and compensate for your own emissions.
Ready to get involved?
>> Learn more about purchasing carbon credits at Carbon Streaming

-

 Real Estate2 weeks ago
Visualizing America’s Shortage of Affordable Homes
-

 Technology1 week ago
Ranked: Semiconductor Companies by Industry Revenue Share
-

 Money2 weeks ago
Which States Have the Highest Minimum Wage in America?
-

 Real Estate2 weeks ago
Ranked: The Most Valuable Housing Markets in America
-

 Business2 weeks ago
Charted: Big Four Market Share by S&P 500 Audits
-

 AI2 weeks ago
The Stock Performance of U.S. Chipmakers So Far in 2024
-

 Misc2 weeks ago
Almost Every EV Stock is Down After Q1 2024
-

 Money2 weeks ago
Where Does One U.S. Tax Dollar Go?