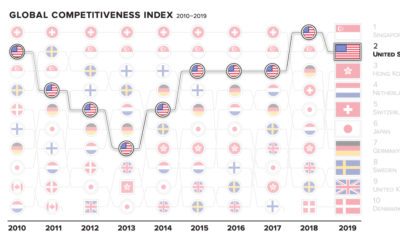

The world's top countries excel in many fields—but there can only be one #1. How have the most competitive economies shifted in the past decade?
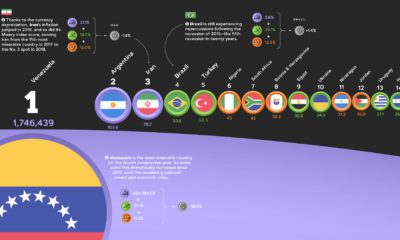

The annual Misery Index ranks the most and least miserable countries, based on four economic factors—unemployment, inflation, lending rates, and GDP growth.
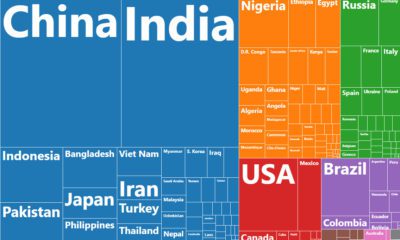

This chart resizes the world's countries based on population, while organizing them based on region. See where all 7.5 billion people live.
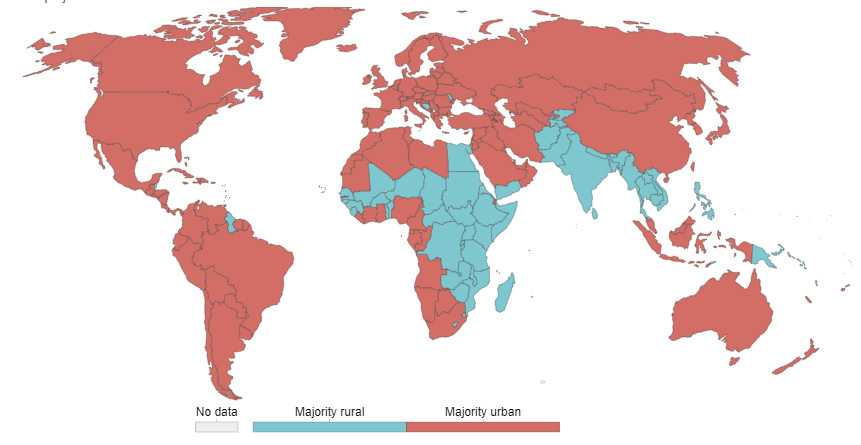
55% of the world lives in urban areas today. But what defines an urban population, and how will this big picture change by 2050?
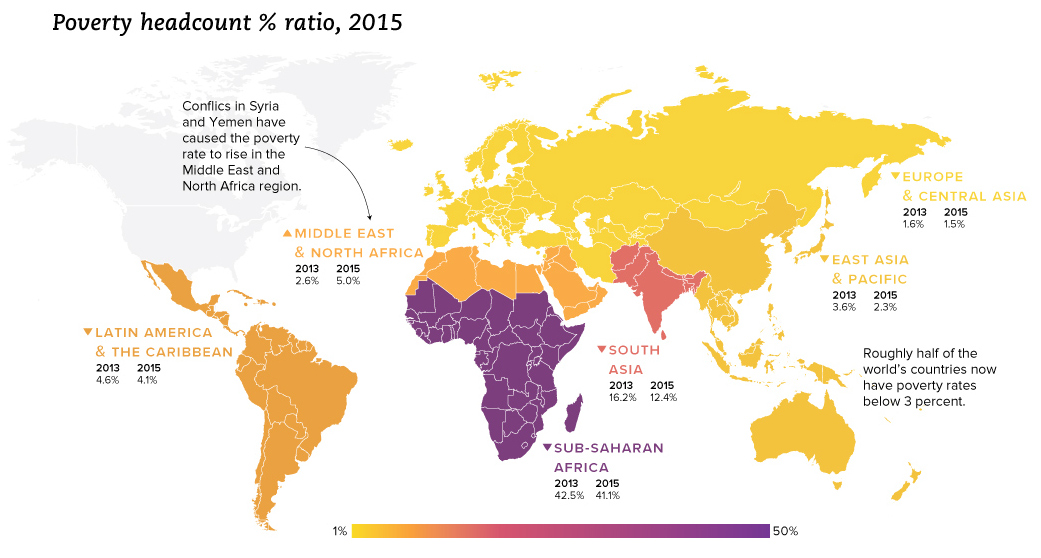
We look at the latest data from the World Bank, which reveals a drop in extreme poverty of 1 billion people globally since the year 1990.
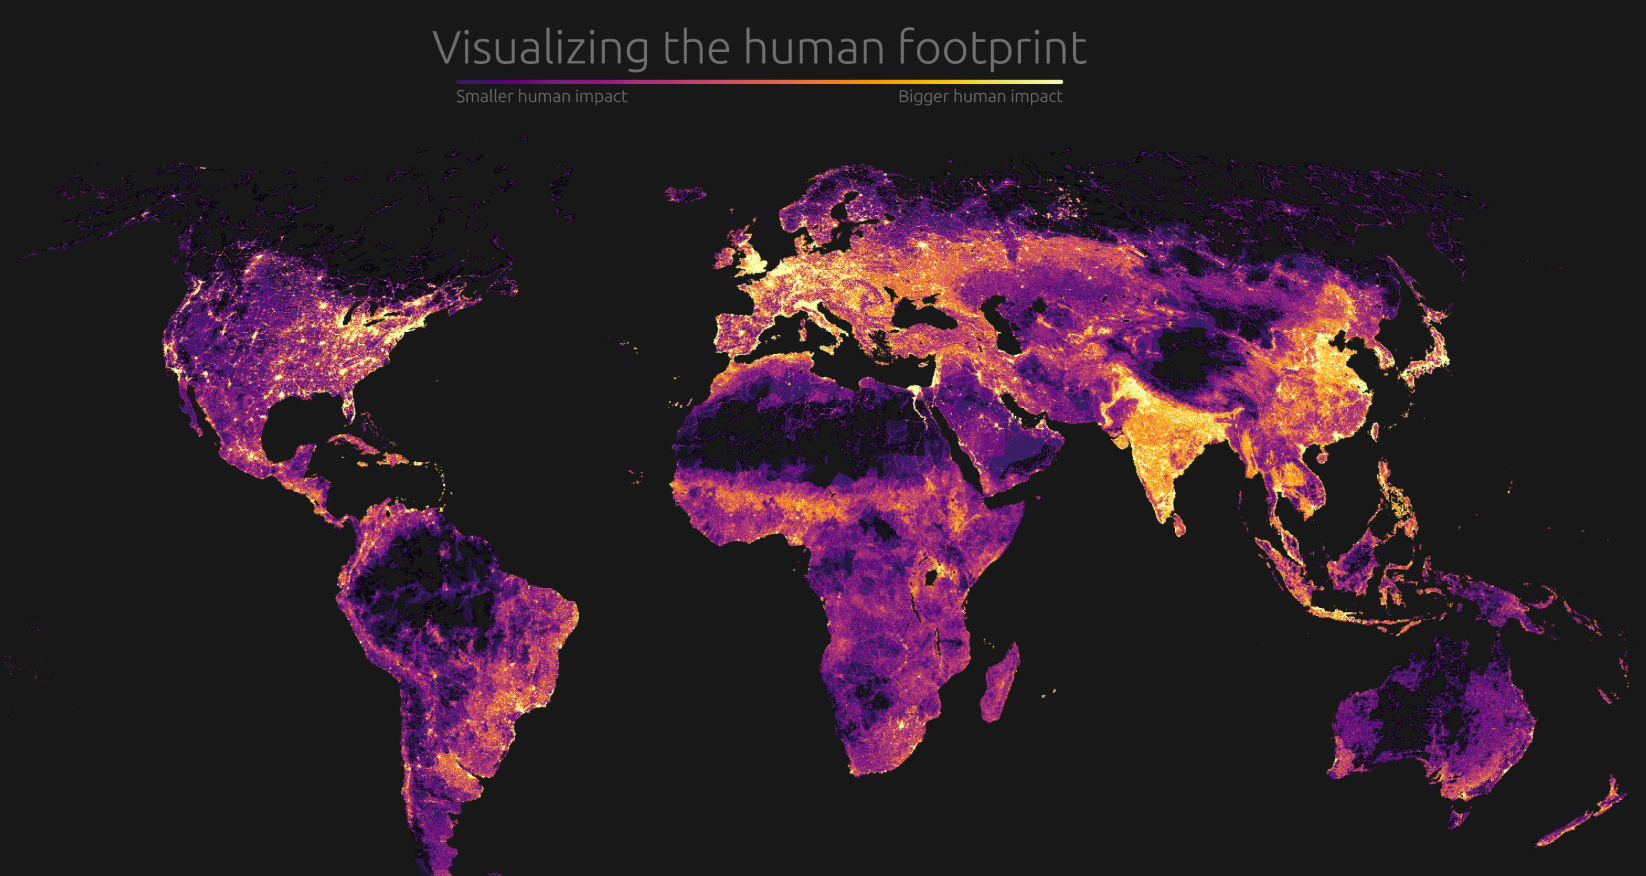
Our impact on the planet has been profound. Today's graphic visualizes this human footprint by looking at population density, roads, undersea cables, and more.
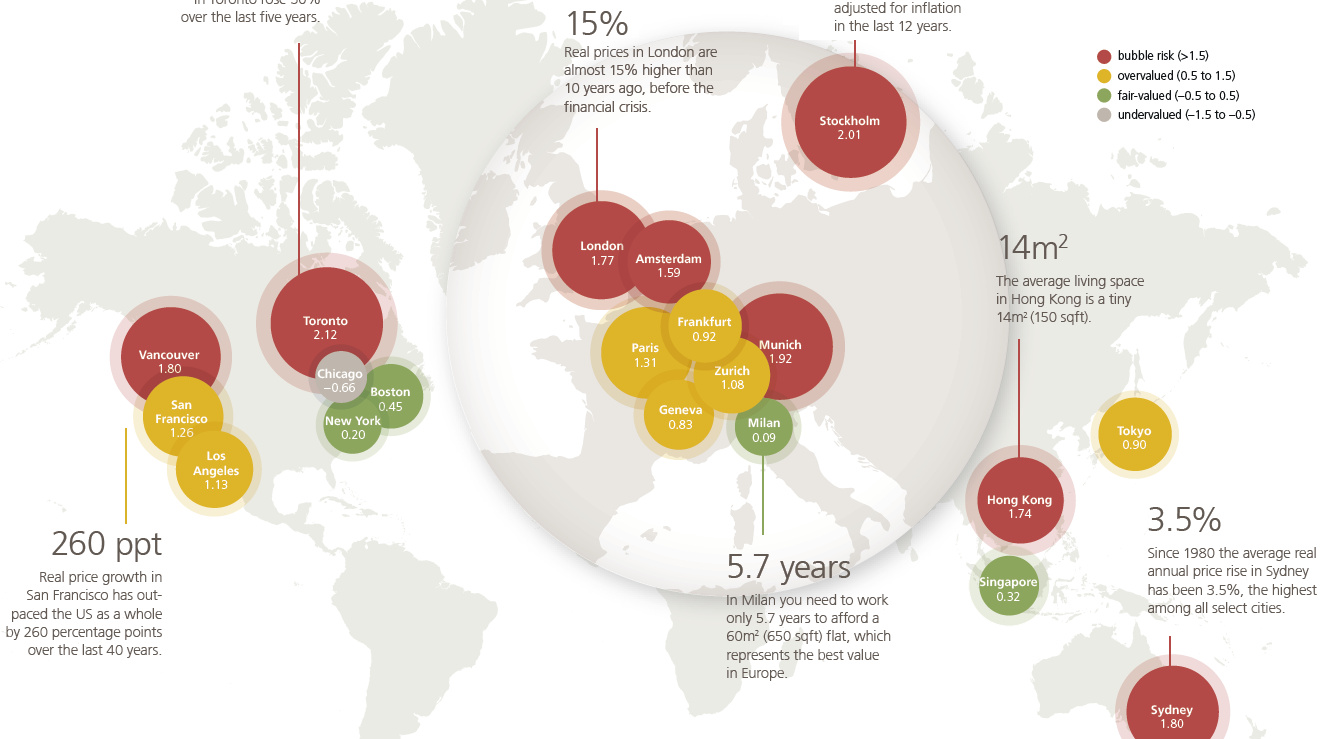
According to UBS, there are eight financial centers that are in bubble territory with real estate prices rising at potentially unsustainable rates.
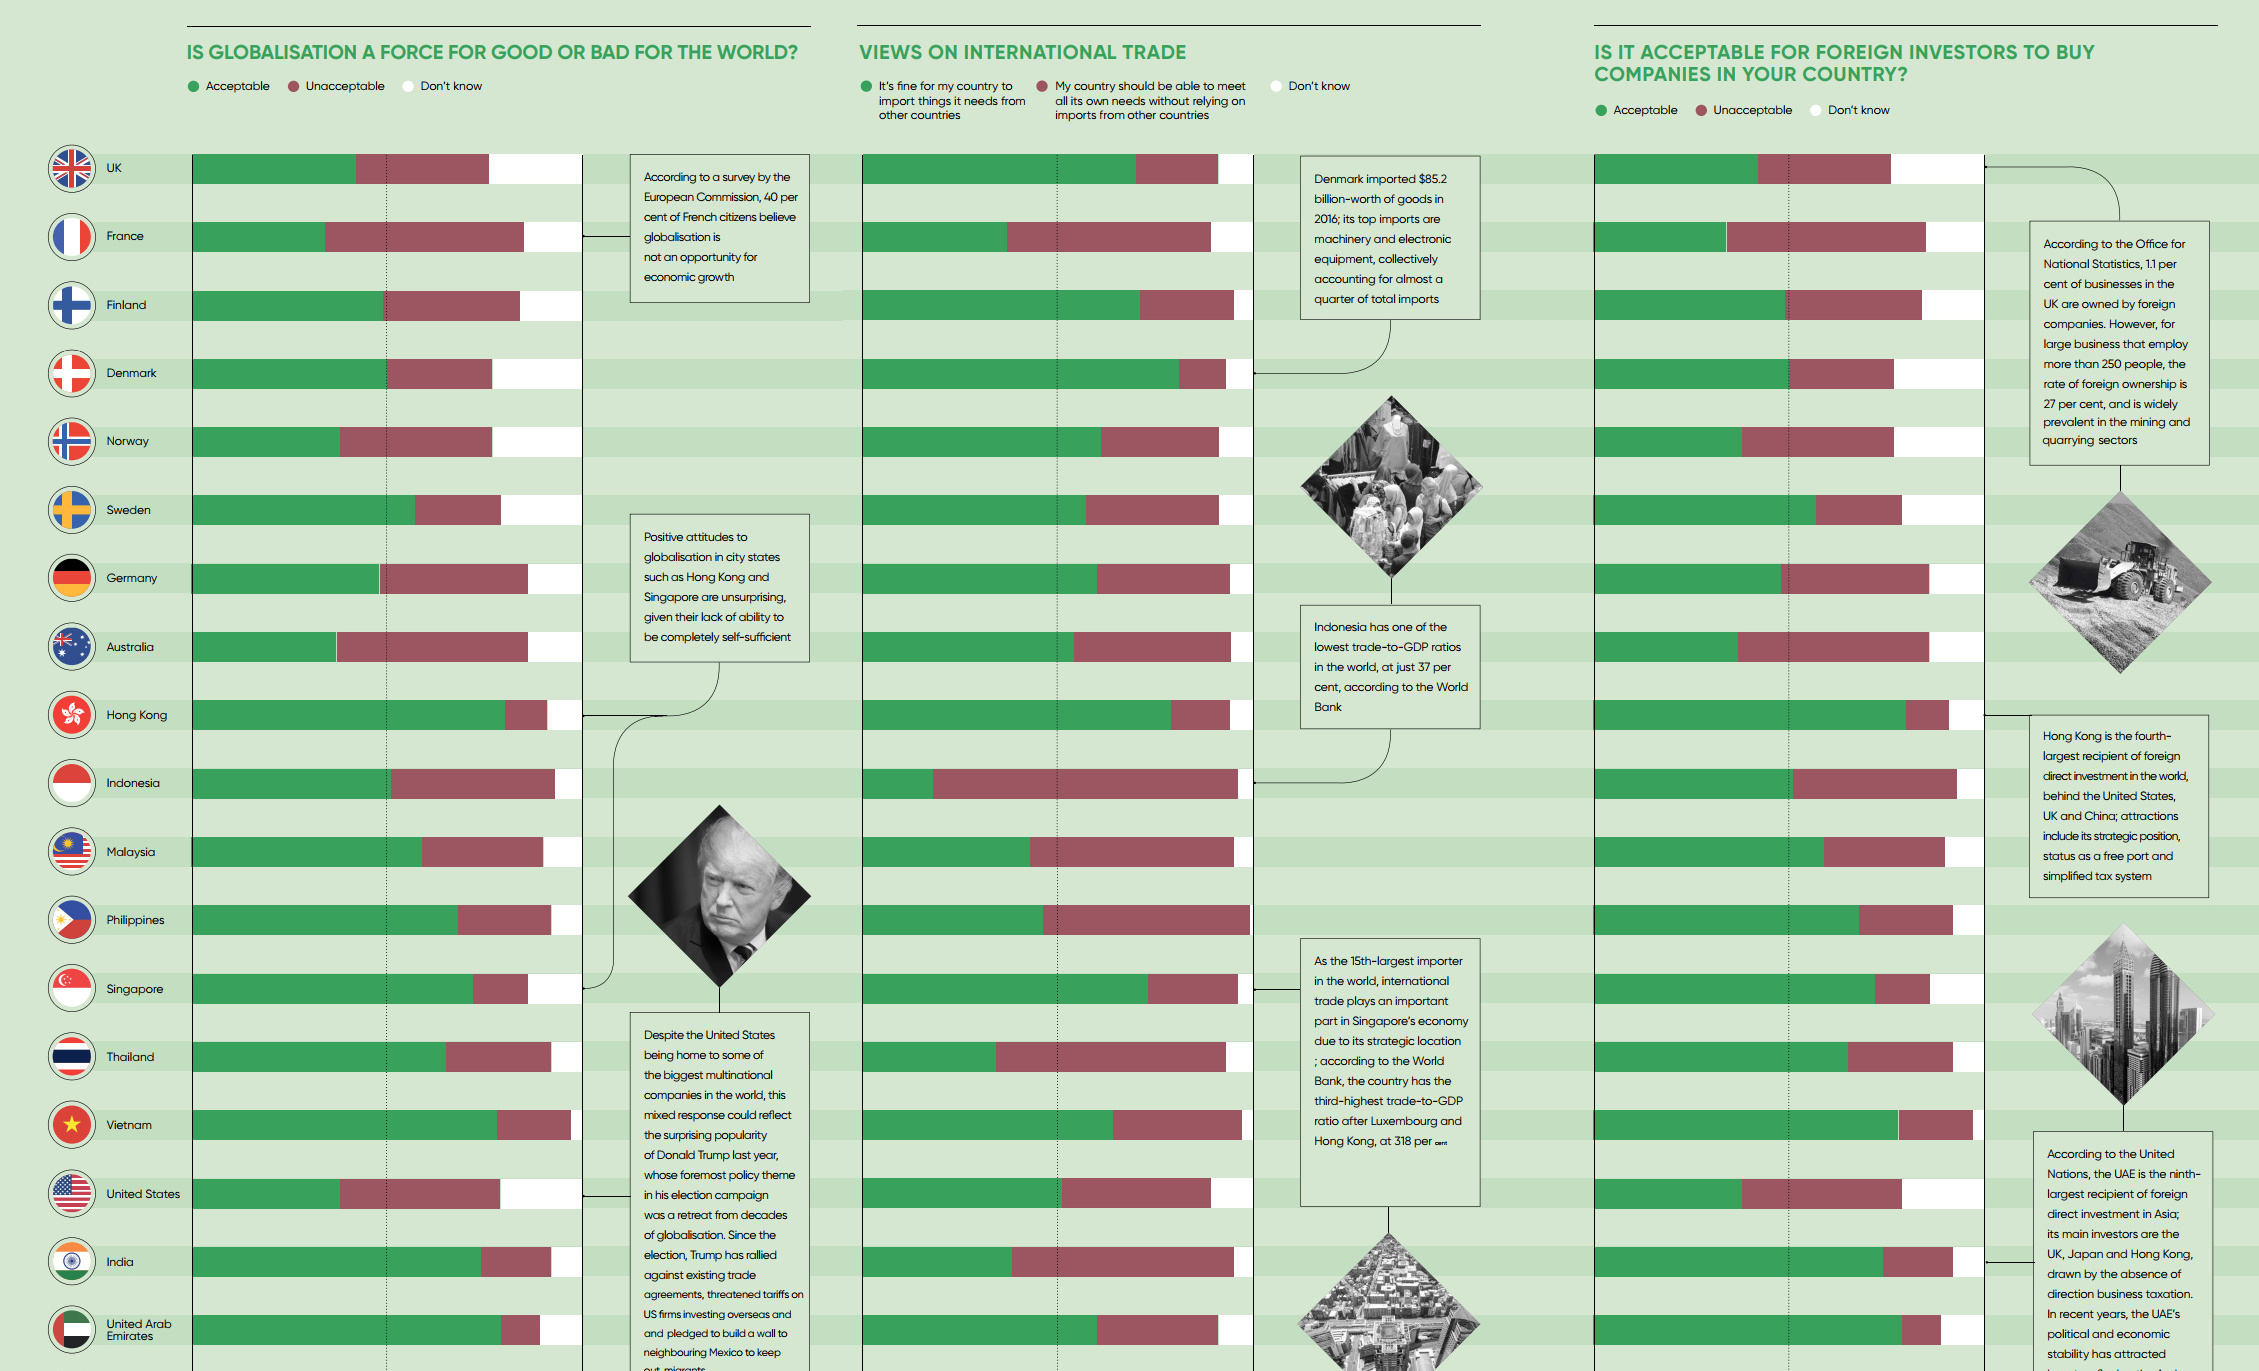
Is globalization a force for good or bad? The answer to this question depends greatly on who you ask - here is a survey of people...
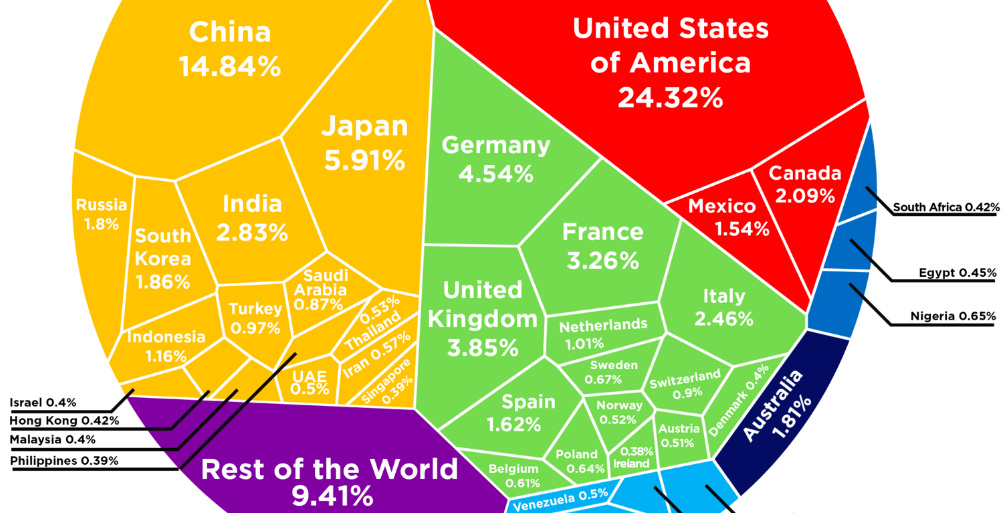
See how the multi-trillion dollar pie of the global economy gets divided between countries, based on the latest data from the World Bank from February 2017.
How has the list of the world's largest companies by revenue changed over the last 20 years? See the rise and fall of the companies on...


