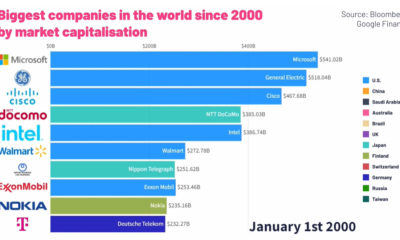

This animated graphic provides a breakdown of the world’s top ten largest public companies from 2000 to 2022.
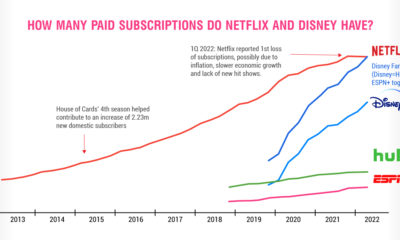

Netflix is a pioneer in video streaming, but Disney's empire is gaining subscribers fast, and giving Netflix a run for its money.
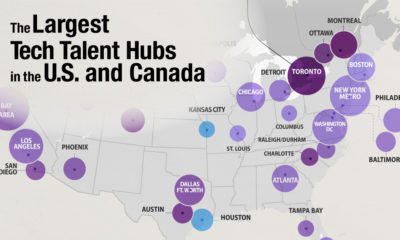

6.5 million skilled tech workers currently work in the U.S. and Canada. Here we look at the largest tech hubs across the two countries
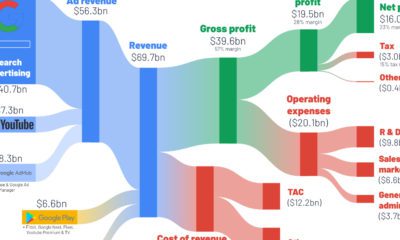

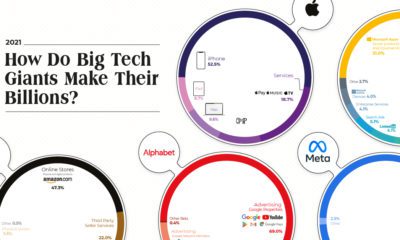
How do the big tech giants make their money? This series of graphics shows a breakdown of big tech revenue, using Q2 2022 income statements.
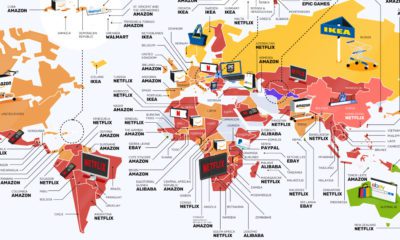

From Netflix to IKEA, this map of the world highlights the most searched for consumer brands around the world.
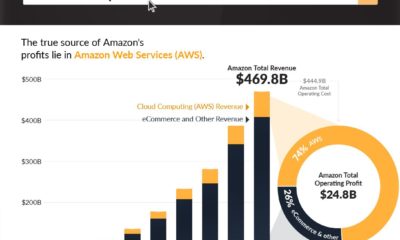

Amazon is best known for its sprawling ecommerce empire, but three-quarters of the company's profits actually come from cloud computing.

The Big Five tech companies made $1.4 trillion in revenue combined—more than Mexico’s entire GDP. Here's how they earned it all.


How much has the world’s land use changed over the last 10,000 years, and how have forests been impacted?


Amazon's shipping costs have surged to over $150 billion - a number that has almost doubled since the start of the pandemic.
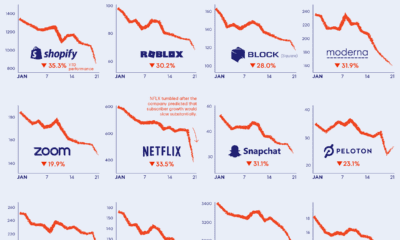

Worries over post-COVID demand and rising interest rates have fueled a market selloff, with pandemic stocks hit particularly hard.


 Creator Program