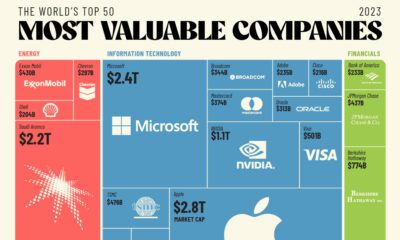

The world's 50 most valuable companies represent over $25 trillion in market cap. We break this massive figure down by company and sector.
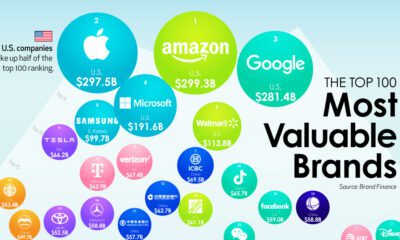

We show the top companies by brand value—and the brands that are rising the fastest as consumer expectations shift.


S&P 500 companies make up $34 trillion in market value combined. This graphic shows how they break down by weight and sector.


The Amazon rainforest plays a critical role in supporting crop growth by stabilizing the climate and balancing water cycles.
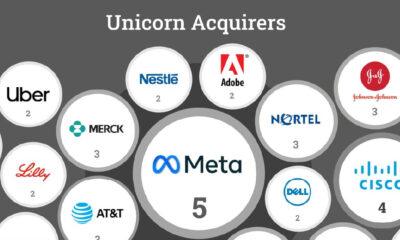

Roughly 30% of unicorns making an exit get acquired. But which companies have made the most U.S. unicorn acquisitions in the last 25 years?
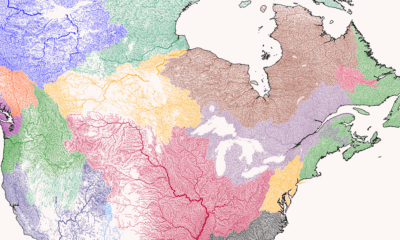

Where does each river start, converge, and end? This series of maps traces river basins in each continent around the world.
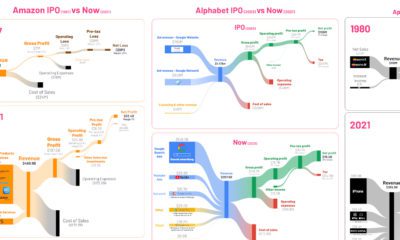

See the financials of major companies like Amazon and Tesla visualized, comparing their first year post-IPO with the most recent numbers.
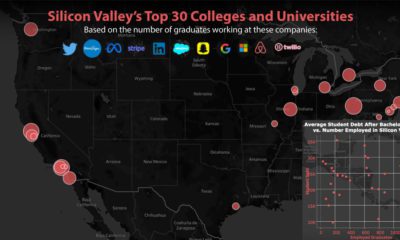

This graphic shows the top feeder schools to Silicon Valley, based on employee data from 12 different companies, including Twitter and Meta.
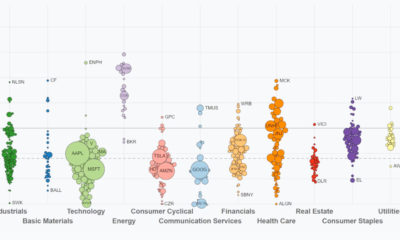

This video highlights S&P 500 performance through Q3. See how sectors and key companies have performed from Jan 1 to Sep 30, 2022.
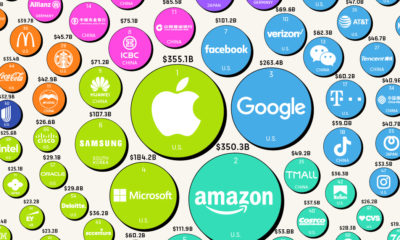

A strong brand is extremely lucrative when leveraged properly. Here's a look at the most valuable brands in 2022, according to Brand Finance.


 Creator Program