Mining
The Story of the Golden Triangle in British Columbia
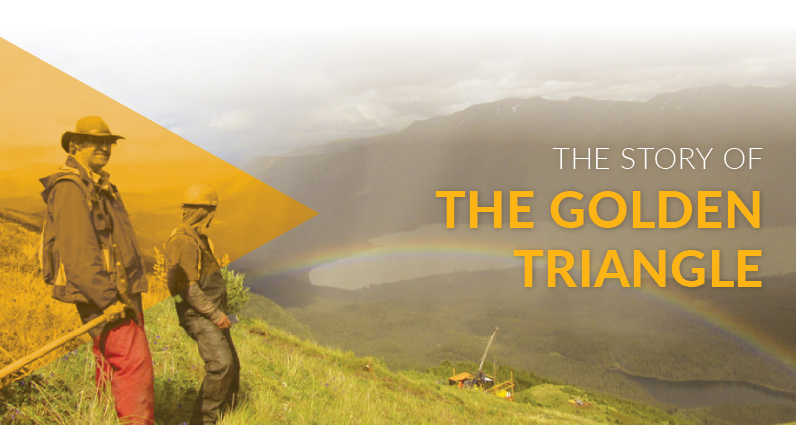
The Golden Triangle
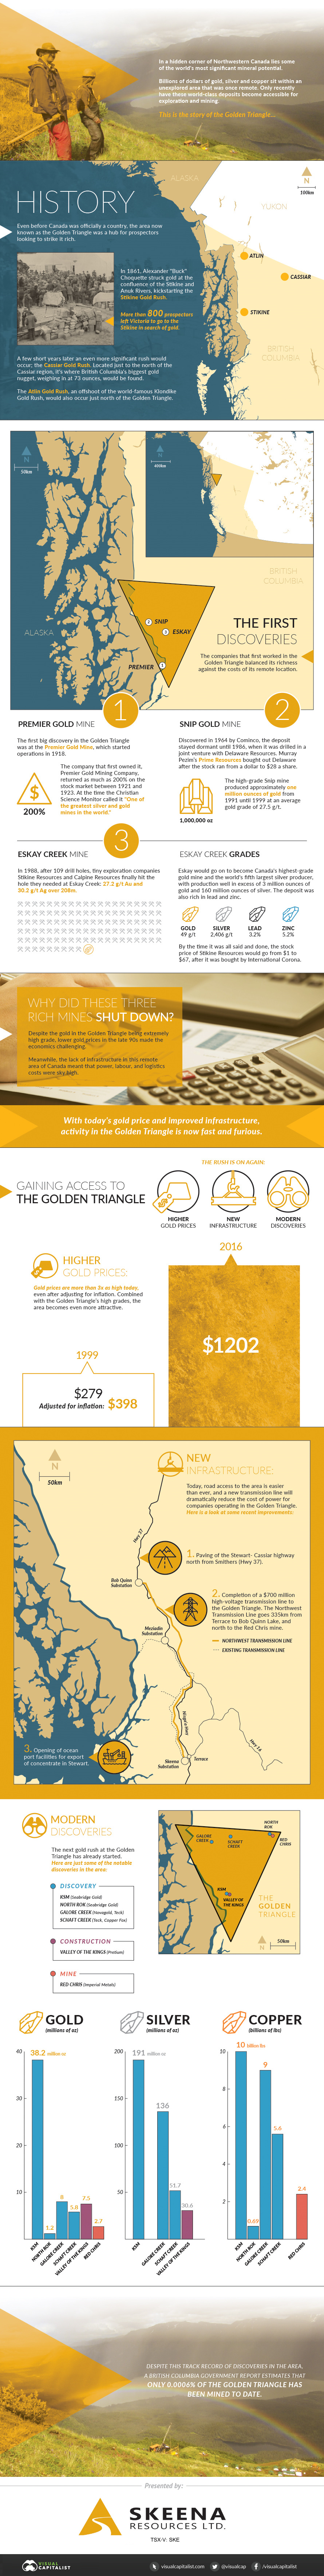
In a hidden corner of Northwestern Canada lies some of the world’s most significant mineral potential.
Billions of dollars of undiscovered gold, silver, and copper still sit within an unexplored area that was once remote. However, only now can these world-class deposits be finally tapped.
Skeena Resources has generously helped us to put together the story of the famed Golden Triangle.
The History of the Golden Triangle
Even before Canada was officially a country, the area now known as the Golden Triangle was a hub for prospectors looking to strike it rich.
In 1861, Alexander “Buck” Choquette struck gold at the confluence of the Stikine and Anuk Rivers, kickstarting the Stikine Gold Rush. More than 800 prospectors left Victoria to go to the Stikine in search of gold.
A few short years later, an even more significant rush would occur just to the north in the Cassiar region – it’s where British Columbia’s biggest ever gold nugget, weighing in at 73 ounces, would be found. The Atlin Gold Rush, an offshoot of the world-famous Klondike Gold Rush, would also occur just north of the Triangle.
The First Discoveries
The companies that first worked in the Golden Triangle balanced its richness against the costs of its remote location.
1. Premier Gold Mine
The first big discovery in the Golden Triangle was at the Premier Gold Mine, which started operations in 1918.
The company that first owned it, Premier Gold Mining Company, returned as much as 200% on the stock market between 1921 and 1923. At the time the Christian Science Monitor called it “One of the greatest silver and gold mines in the world.”
2. Snip Mine
Discovered in 1964 by Cominco, the deposit stayed dormant until 1986, when it was drilled in a joint venture with Delaware Resources. Murray Pezim’s Prime Resources bought out Delaware after the stock ran from a dollar to $28 a share.
The high-grade Snip mine produced approximately one million ounces of gold from 1991 until 1999 at an average gold grade of 27.5 g/t.
3. Eskay Creek
In 1988, after a 109 drill holes, tiny exploration companies Stikine Resources and Calpine Resources finally hit the hole they needed at Eskay Creek: 27.2 g/t Au and 30.2 g/t Ag over 208m.
Eskay would go on to become Canada’s highest-grade gold mine and the world’s fifth largest silver producer, with production well in excess of 3 million ounces of gold and 160 million ounces of silver.
Grades:
Gold: 49 g/t
Silver: 2,406 g/t
Lead: 3.2%
Zinc: 5.2%
By the time it was all said and done, the stock price of Stikine Resources would go from $1 to $67, after it was bought by International Corona.
Why did these three rich mines shut down?
Despite the gold in the Triangle being extremely high grade, lower gold prices in the late 90s made the economics challenging. Meanwhile, the lack of infrastructure in this remote area of Canada meant that power, labor, and logistics costs were sky high.
Both of these things have changed today, and activity at the Golden Triangle is now fast and furious.
Gaining Access to the Triangle
The Golden Triangle is a hot area for exploration again. This is for three main reasons: higher gold prices, new infrastructure, and modern discoveries.
Higher gold prices
Average gold price (1999): $279 (Adjusted for inflation: $398)
Average gold price (2016): $1202
Gold prices are more than 3x as high today, even after adjusting for inflation. Combined with the Golden Triangle’s high grades, this becomes even more attractive.
New Infrastructure:
Today, road access to the area is easier than ever, and a new transmission line will dramatically reduce the cost of power for companies operating in the Triangle.
Recent improvements:
- Completion of a $700 million high-voltage transmission line to the Golden Triangle. The Northwest Transmission Line goes 335km from Terrace to Bob Quinn Lake, and north to the Red Chris mine
- Paving of the Stewart-Cassiar highway north from Smithers (Hwy 37)
- Opening of ocean port facilities for export of concentrate in Stewart
- Completion of a three dam, 277 MW hydroelectric facility located 70km northwest of Stewart
With new infrastructure in tow, the Golden Triangle is now open for business.
Modern Discoveries
The next gold rush at the Golden Triangle has already started.
Just some of the new discoveries in the area include Seabridge’s KSM project, Pretium’s Valley of the Kings deposit, and Imperial Metal’s Red Chris mine.
Yet, despite this track record of new discoveries and mines being built in the area, a British Columbia government report estimates that only 0.0006% of the Golden Triangle has been mined to date.


Lithium
Ranked: The Top 10 EV Battery Manufacturers in 2023
Asia dominates this ranking of the world’s largest EV battery manufacturers in 2023.


The Top 10 EV Battery Manufacturers in 2023
This was originally posted on our Voronoi app. Download the app for free on iOS or Android and discover incredible data-driven charts from a variety of trusted sources.
Despite efforts from the U.S. and EU to secure local domestic supply, all major EV battery manufacturers remain based in Asia.
In this graphic we rank the top 10 EV battery manufacturers by total battery deployment (measured in megawatt-hours) in 2023. The data is from EV Volumes.
Chinese Dominance
Contemporary Amperex Technology Co. Limited (CATL) has swiftly risen in less than a decade to claim the title of the largest global battery group.
The Chinese company now has a 34% share of the market and supplies batteries to a range of made-in-China vehicles, including the Tesla Model Y, SAIC’s MG4/Mulan, and various Li Auto models.
| Company | Country | 2023 Production (megawatt-hour) | Share of Total Production |
|---|---|---|---|
| CATL | 🇨🇳 China | 242,700 | 34% |
| BYD | 🇨🇳 China | 115,917 | 16% |
| LG Energy Solution | 🇰🇷 Korea | 108,487 | 15% |
| Panasonic | 🇯🇵 Japan | 56,560 | 8% |
| SK On | 🇰🇷 Korea | 40,711 | 6% |
| Samsung SDI | 🇰🇷 Korea | 35,703 | 5% |
| CALB | 🇨🇳 China | 23,493 | 3% |
| Farasis Energy | 🇨🇳 China | 16,527 | 2% |
| Envision AESC | 🇨🇳 China | 8,342 | 1% |
| Sunwoda | 🇨🇳 China | 6,979 | 1% |
| Other | - | 56,040 | 8% |
In 2023, BYD surpassed LG Energy Solution to claim second place. This was driven by demand from its own models and growth in third-party deals, including providing batteries for the made-in-Germany Tesla Model Y, Toyota bZ3, Changan UNI-V, Venucia V-Online, as well as several Haval and FAW models.
The top three battery makers (CATL, BYD, LG) collectively account for two-thirds (66%) of total battery deployment.
Once a leader in the EV battery business, Panasonic now holds the fourth position with an 8% market share, down from 9% last year. With its main client, Tesla, now sourcing batteries from multiple suppliers, the Japanese battery maker seems to be losing its competitive edge in the industry.
Overall, the global EV battery market size is projected to grow from $49 billion in 2022 to $98 billion by 2029, according to Fortune Business Insights.

-

 Science7 days ago
Visualizing the Average Lifespans of Mammals
-

 Markets2 weeks ago
The Top 10 States by Real GDP Growth in 2023
-

 Demographics2 weeks ago
The Smallest Gender Wage Gaps in OECD Countries
-

 United States2 weeks ago
Where U.S. Inflation Hit the Hardest in March 2024
-

 Green2 weeks ago
Top Countries By Forest Growth Since 2001
-

 United States2 weeks ago
Ranked: The Largest U.S. Corporations by Number of Employees
-

 Maps2 weeks ago
The Largest Earthquakes in the New York Area (1970-2024)
-

 Green2 weeks ago
Ranked: The Countries With the Most Air Pollution in 2023