Markets
Ranked: Which Airlines Carried the Most Passengers in 2022?
Ranked: Which Airlines Carried the Most Passengers in 2022?
After being battered by the pandemic, the airline industry is on the upswing, with traffic growing 30% and revenue surging 50% year-on-year in 2022.
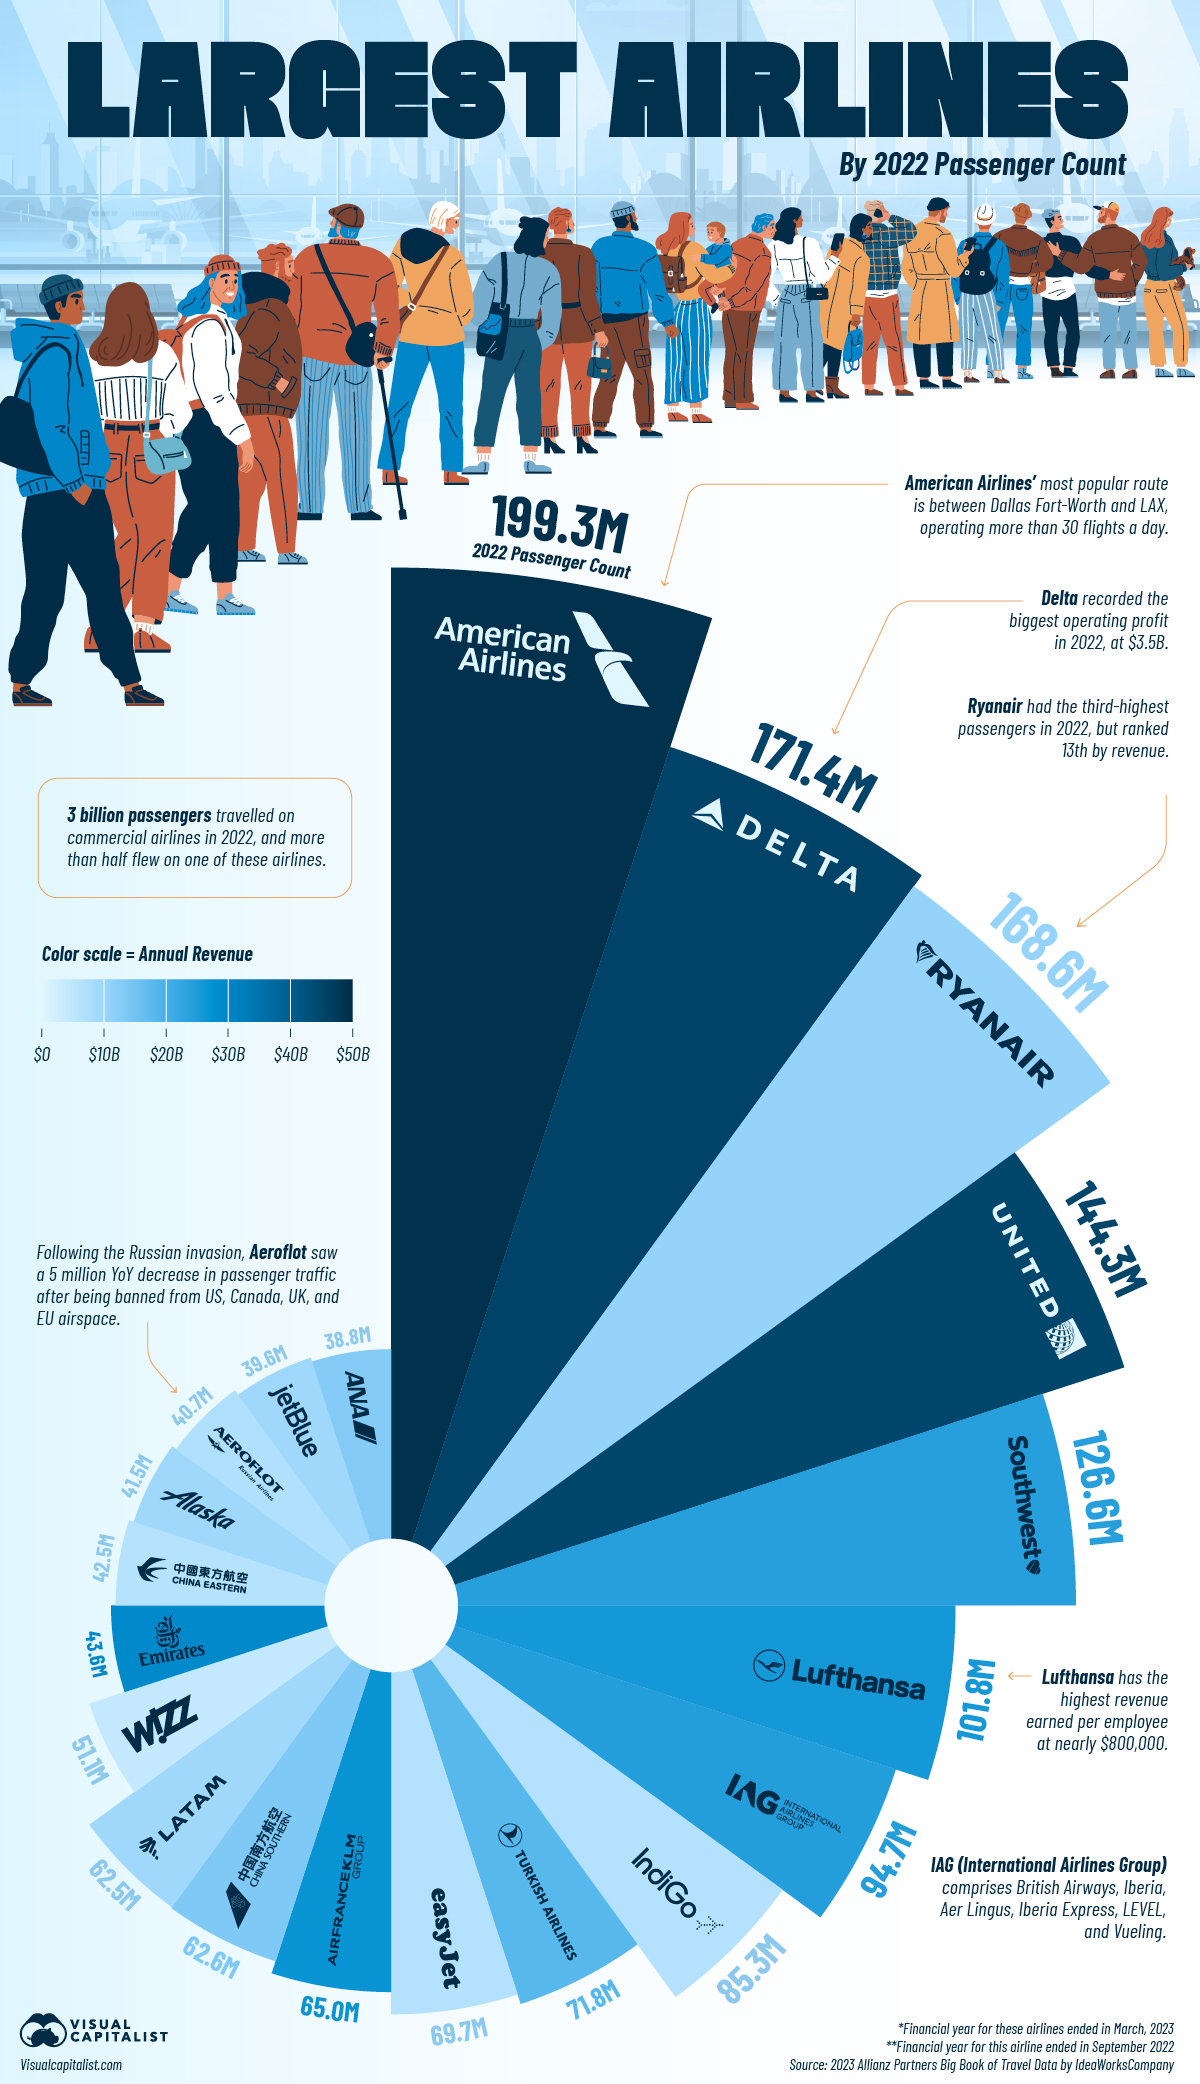
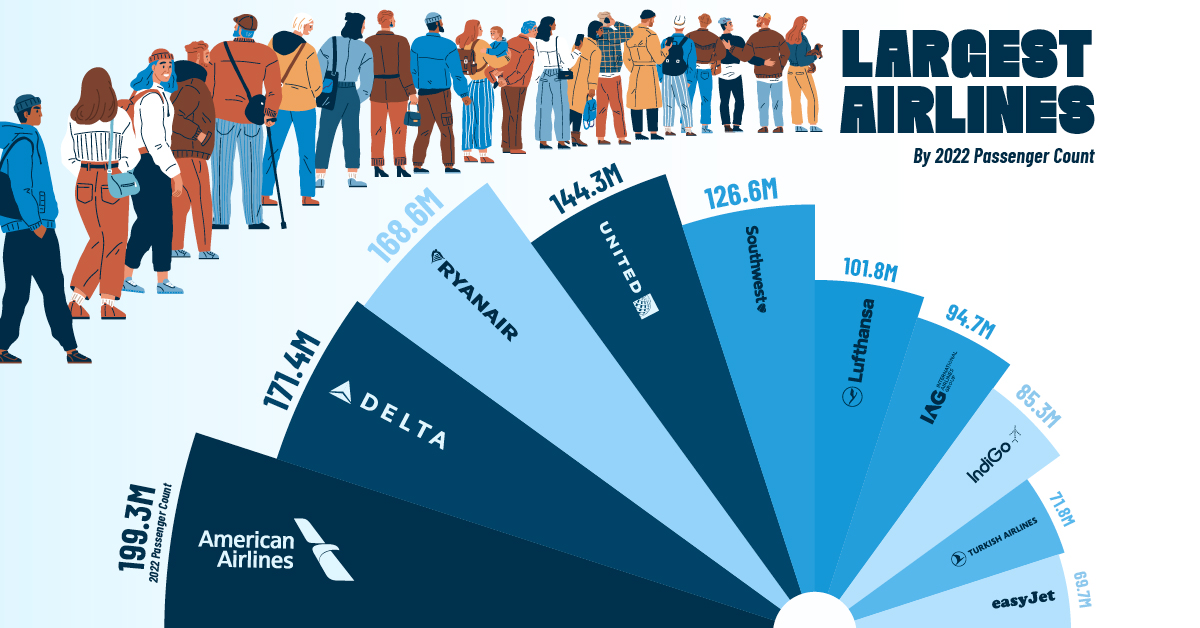
And of the 3 billion passengers who took a flight last year, more than half flew on one of the big players in the industry. We use information from 2023 Allianz Partners Big Book of Travel Data by IdeaWorksCompany to visualize the largest airlines by traffic.
The Top 20 Airlines By Traffic in 2022
At the top of the list, American Airlines flew nearly 200 million passengers in 2022. The airline’s most popular route was between Dallas Fort-Worth (DFW) and Los Angeles (LAX), operating more than 30 flights a day.
In fact, Dallas is a “fortress hub” for American, where the airline—along with its regional partners—own more than 70% of the airport’s flights.
Here’s a quick look at the other airlines and their annual passengers in 2022.
| Rank | Airline | Headquartered | Annual Passengers |
|---|---|---|---|
| 1 | American Airlines | 🇺🇸 U.S. | 199.3M |
| 2 | Delta Airlines | 🇺🇸 U.S. | 171.4M |
| 3 | Ryanair Group* | 🇮🇪 Ireland | 168.6M |
| 4 | United Airlines | 🇺🇸 U.S. | 144.3M |
| 5 | Southwest Airlines | 🇺🇸 U.S. | 126.6M |
| 6 | Lufthansa Group | 🇩🇪 Germany | 101.8M |
| 7 | International Airlines Group (IAG) | 🇬🇧 UK | 94.7M |
| 8 | IndiGo* | 🇮🇳 India | 85.3M |
| 9 | Turkish Airlines Group | 🇹🇷 Türkiye | 71.8M |
| 10 | easyJet** | 🇬🇧 UK | 69.7M |
| 11 | Air France / KLM Group | 🇫🇷 France | 65.0M |
| 12 | China Southern Group | 🇨🇳 China | 62.6M |
| 13 | LATAM Group | 🇨🇱 Chile | 62.4M |
| 14 | Wizz Air* | 🇭🇺 Hungary | 51.1M |
| 15 | Emirates Airline* | 🇦🇪 UAE | 43.6M |
| 16 | China Eastern Group | 🇨🇳 China | 42.5M |
| 17 | Alaska Air Group | 🇺🇸 U.S. | 41.5M |
| 18 | Aeroflot Group | 🇷🇺 Russia | 40.7M |
| 19 | JetBlue Airways | 🇺🇸 U.S. | 39.6M |
| 20 | ANA Group* | 🇯🇵 Japan | 38.7M |
*Financial year for these airlines ended in March, 2023. **Financial year for this airline ended in September 2022.
Close behind American is another U.S.-based rival, Delta, which got more than 170 million passengers to their destinations.
Ranked third is Ryanair Group, headquartered in Ireland, the most popular of the low-cost carriers (defined by their lower fares and no-frills service) which transported more than 168 million passengers around the world.
Rounding out the top five are two other U.S.-based airlines, United and Southwest, with annual passenger figures of 144.3 million and 126.6 million respectively.
Ranked: Top 20 Airlines By Revenue in 2022
Examining the same list of airlines by the most revenue earned over the year throws up a few interesting surprises.
| Rank | Airline | Headquartered | Annual Revenue (USD Billions) |
|---|---|---|---|
| 1 | American Airlines | 🇺🇸 U.S. | $49.0 |
| 2 | Delta Airlines | 🇺🇸 U.S. | $45.6 |
| 3 | United Airlines | 🇺🇸 U.S. | $45.0 |
| 4 | Emirates Airline* | 🇦🇪 UAE | $29.2 |
| 5 | Air France / KLM Group | 🇫🇷 France | $27.5 |
| 6 | Lufthansa Group | 🇩🇪 Germany | $26.9 |
| 7 | International Airlines Group (IAG) | 🇬🇧 UK | $24.0 |
| 8 | Southwest Airlines | 🇺🇸 U.S. | $23.8 |
| 9 | Turkish Airlines Group | 🇹🇷 Türkiye | $18.4 |
| 10 | China Southern Group | 🇨🇳 China | $13.0 |
| 11 | ANA Group* | 🇯🇵 Japan | $12.6 |
| 12 | Ryanair Group* | 🇮🇪 Ireland | $11.2 |
| 13 | Alaska Air Group | 🇺🇸 U.S. | $9.7 |
| 14 | LATAM Group | 🇨🇱 Chile | $9.4 |
| 15 | JetBlue Airways | 🇺🇸 U.S. | $9.2 |
| 16 | Aeroflot Group | 🇷🇺 Russia | $7.7 |
| 17 | IndiGo* | 🇮🇳 India | $7.1 |
| 18 | easyJet** | 🇬🇧 UK | $7.0 |
| 19 | China Eastern Group | 🇨🇳 China | $6.9 |
| 20 | Wizz Air* | 🇭🇺 Hungary | $4.1 |
*Financial year for these airlines ended in March, 2023. **Financial year for this airline ended in September 2022.
American and Delta retain their top positions—earning $49 billion and $45 billion respectively—but Ryanair Group falls out of the top five to 12th place, having made $11.2 billion last year.
Other low-cost carriers—IndiGo from India and EasyJet from the UK—also slide down ranks, both pulling in about $7 billion in revenue.
Air Passenger Traffic by Region in 2022
Airlines with headquarters in Europe transported one-third of all air passengers in 2022, slightly ahead of their U.S.-based counterparts.
| Region | Passenger Share (2022) |
|---|---|
| Europe | 31.5% |
| U.S. & Canada | 29.7% |
| Asia & South Pacific | 23.3% |
| Latin America | 9.2% |
| Middle East & Africa | 6.4% |
This was despite Russia’s Aeroflot losing both passengers and revenue between 2021–2022, as the airline was banned from entering the U.S., Canada, UK, and EU airspace.
Meanwhile, all four of China’s largest airlines also suffered traffic drops as the country grappled with residual effects of the pandemic, impacting Asia’s share of passengers.


Markets
Mapped: Europe’s GDP Per Capita, by Country
Which European economies are richest on a GDP per capita basis? This map shows the results for 44 countries across the continent.


Mapped: Europe’s GDP Per Capita, by Country (2024)
This was originally posted on our Voronoi app. Download the app for free on iOS or Android and discover incredible data-driven charts from a variety of trusted sources.
Europe is home to some of the largest and most sophisticated economies in the world. But how do countries in the region compare with each other on a per capita productivity basis?
In this map, we show Europe’s GDP per capita levels across 44 nations in current U.S. dollars. Data for this visualization and article is sourced from the International Monetary Fund (IMF) via their DataMapper tool, updated April 2024.
Europe’s Richest and Poorest Nations, By GDP Per Capita
Luxembourg, Ireland, and Switzerland, lead the list of Europe’s richest nations by GDP per capita, all above $100,000.
| Rank | Country | GDP Per Capita (2024) |
|---|---|---|
| 1 | 🇱🇺 Luxembourg | $131,380 |
| 2 | 🇮🇪 Ireland | $106,060 |
| 3 | 🇨🇭 Switzerland | $105,670 |
| 4 | 🇳🇴 Norway | $94,660 |
| 5 | 🇮🇸 Iceland | $84,590 |
| 6 | 🇩🇰 Denmark | $68,900 |
| 7 | 🇳🇱 Netherlands | $63,750 |
| 8 | 🇸🇲 San Marino | $59,410 |
| 9 | 🇦🇹 Austria | $59,230 |
| 10 | 🇸🇪 Sweden | $58,530 |
| 11 | 🇧🇪 Belgium | $55,540 |
| 12 | 🇫🇮 Finland | $55,130 |
| 13 | 🇩🇪 Germany | $54,290 |
| 14 | 🇬🇧 UK | $51,070 |
| 15 | 🇫🇷 France | $47,360 |
| 16 | 🇦🇩 Andorra | $44,900 |
| 17 | 🇲🇹 Malta | $41,740 |
| 18 | 🇮🇹 Italy | $39,580 |
| 19 | 🇨🇾 Cyprus | $37,150 |
| 20 | 🇪🇸 Spain | $34,050 |
| 21 | 🇸🇮 Slovenia | $34,030 |
| 22 | 🇪🇪 Estonia | $31,850 |
| 23 | 🇨🇿 Czech Republic | $29,800 |
| 24 | 🇵🇹 Portugal | $28,970 |
| 25 | 🇱🇹 Lithuania | $28,410 |
| 26 | 🇸🇰 Slovakia | $25,930 |
| 27 | 🇱🇻 Latvia | $24,190 |
| 28 | 🇬🇷 Greece | $23,970 |
| 29 | 🇭🇺 Hungary | $23,320 |
| 30 | 🇵🇱 Poland | $23,010 |
| 31 | 🇭🇷 Croatia | $22,970 |
| 32 | 🇷🇴 Romania | $19,530 |
| 33 | 🇧🇬 Bulgaria | $16,940 |
| 34 | 🇷🇺 Russia | $14,390 |
| 35 | 🇹🇷 Türkiye | $12,760 |
| 36 | 🇲🇪 Montenegro | $12,650 |
| 37 | 🇷🇸 Serbia | $12,380 |
| 38 | 🇦🇱 Albania | $8,920 |
| 39 | 🇧🇦 Bosnia & Herzegovina | $8,420 |
| 40 | 🇲🇰 North Macedonia | $7,690 |
| 41 | 🇧🇾 Belarus | $7,560 |
| 42 | 🇲🇩 Moldova | $7,490 |
| 43 | 🇽🇰 Kosovo | $6,390 |
| 44 | 🇺🇦 Ukraine | $5,660 |
| N/A | 🇪🇺 EU Average | $44,200 |
Note: Figures are rounded.
Three Nordic countries (Norway, Iceland, Denmark) also place highly, between $70,000-90,000. Other Nordic peers, Sweden and Finland rank just outside the top 10, between $55,000-60,000.
Meanwhile, Europe’s biggest economies in absolute terms, Germany, UK, and France, rank closer to the middle of the top 20, with GDP per capitas around $50,000.
Finally, at the end of the scale, Eastern Europe as a whole tends to have much lower per capita GDPs. In that group, Ukraine ranks last, at $5,660.
A Closer Look at Ukraine
For a broader comparison, Ukraine’s per capita GDP is similar to Iran ($5,310), El Salvador ($5,540), and Guatemala ($5,680).
According to experts, Ukraine’s economy has historically underperformed to expectations. After the fall of the Berlin Wall, the economy contracted for five straight years. Its transition to a Western, liberalized economic structure was overshadowed by widespread corruption, a limited taxpool, and few revenue sources.
Politically, its transformation from authoritarian regime to civil democracy has proved difficult, especially when it comes to institution building.
Finally, after the 2022 invasion of the country, Ukraine’s GDP contracted by 30% in a single year—the largest loss since independence. Large scale emigration—to the tune of six million refugees—is also playing a role.
Despite these challenges, the country’s economic growth has somewhat stabilized while fighting continues.

-

 Markets5 days ago
Mapped: The Most Valuable Company in Each Southeast Asian Country
-

 Markets2 weeks ago
The Top Private Equity Firms by Country
-

 Jobs2 weeks ago
The Best U.S. Companies to Work for According to LinkedIn
-

 Economy2 weeks ago
Ranked: The Top 20 Countries in Debt to China
-

 Politics1 week ago
Charted: Trust in Government Institutions by G7 Countries
-

 Energy1 week ago
Mapped: The Age of Energy Projects in Interconnection Queues, by State
-

 Mining1 week ago
Visualizing Global Gold Production in 2023
-

 Markets1 week ago
Visualized: Interest Rate Forecasts for Advanced Economies