Energy
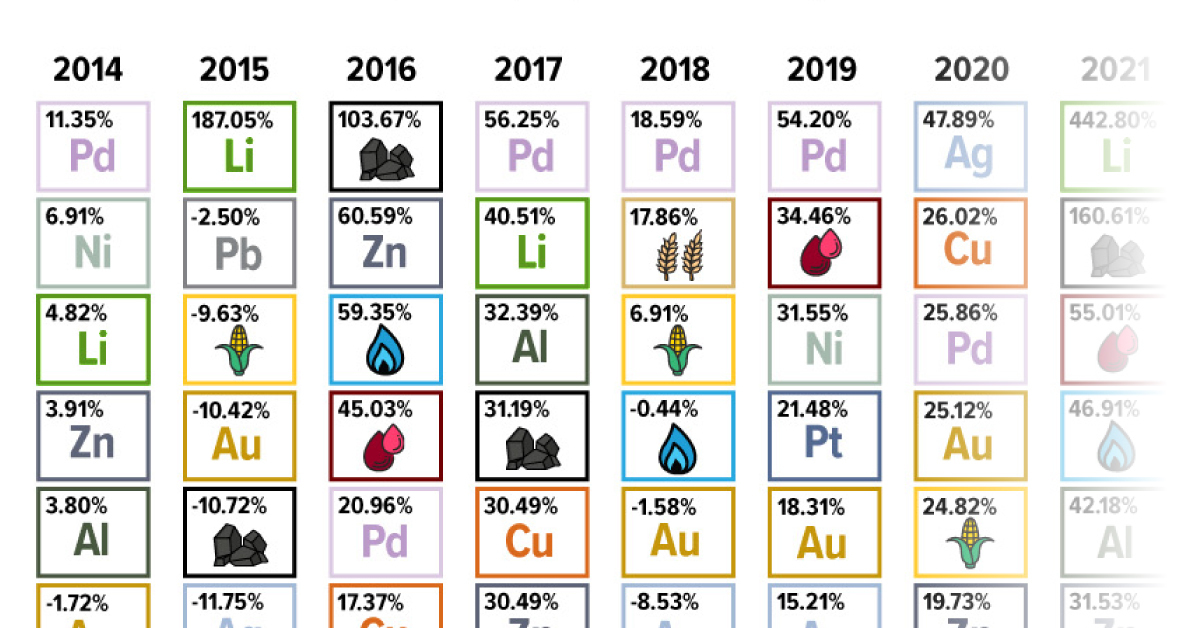
The Periodic Table of Commodity Returns (2014-2023)
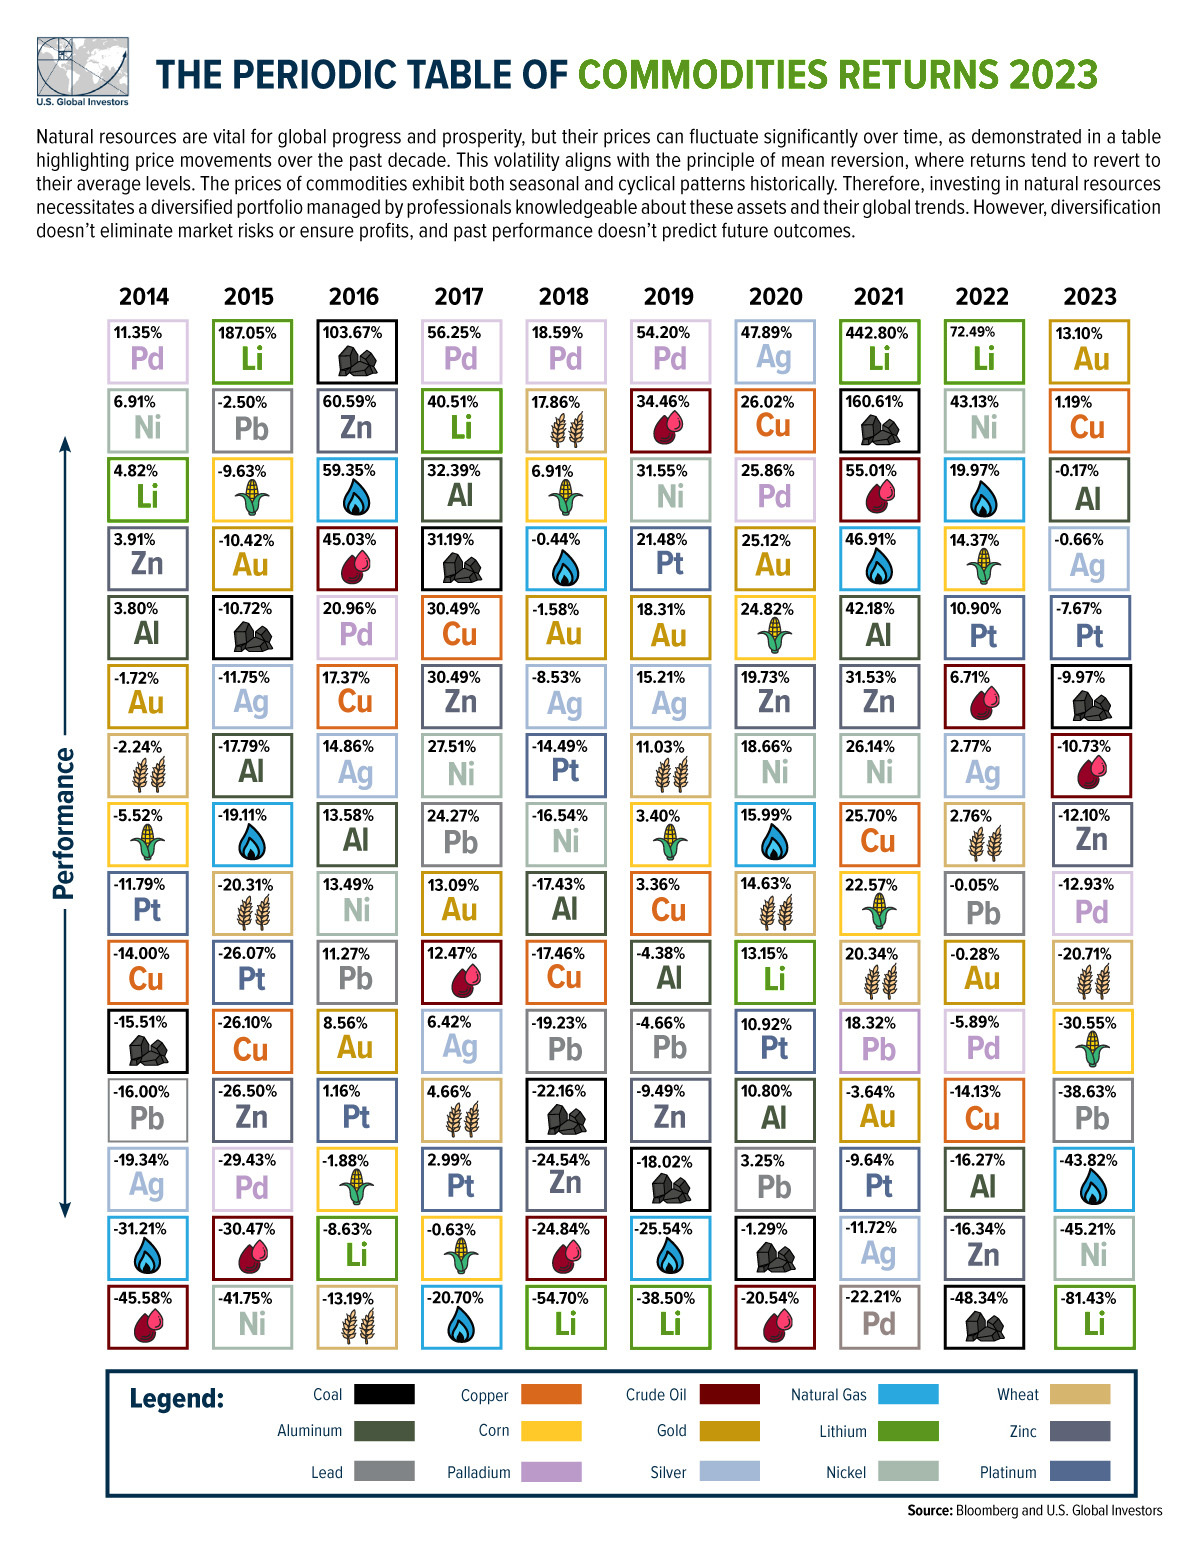
The Periodic Table of Commodity Returns (2014-2023)
It was a challenging year for commodity returns in 2023.
But there were a few exceptions. Gold was a standout performer, reaching record highs of $2,135 an ounce. As rate cuts began to look more likely in 2024, investors sought out the safe-haven asset and a weaker dollar also boosted demand for gold.
Copper, meanwhile, barely etched its way into the green, as China’s slumping property market weighed on demand.
This graphic, based on U.S. Global Investors interactive research, shows commodity returns over the last decade.
Commodity Returns in 2023
After several years of strong performance, most commodities ended 2023 in negative territory, as the table below shows:
| Commodity | 2023 Return |
|---|---|
| Gold | 13.10% |
| Copper | 1.19% |
| Aluminium | -0.17% |
| Silver | -0.66% |
| Platinum | -7.67% |
| Coal | -9.97% |
| Crude Oil | -10.73% |
| Zinc | -12.10% |
| Palladium | -12.93% |
| Wheat | -20.71% |
| Corn | -30.55% |
| Lead | -38.63% |
| Natural Gas | -43.82% |
| Nickel | -45.21% |
| Lithium | -81.43% |
In a departure from other commodities, gold jumped over 13%, driven by investor demand and central bank purchases.
Over the first three quarters of 2023, global central banks bought roughly 800 tonnes of gold, with China, Poland, and Singapore being the top buyers.
Crude oil sank nearly 11%. In 2023, the U.S. produced a record 13.3 million barrels per day in mid-December, supported by growing operational efficiencies. The number of active U.S. oil rigs stands at 501—a 69% decline from a decade ago.
Also putting pressure on oil prices was slower global demand as interest rates notched higher.
Like crude oil, the supply of lithium and nickel were robust last year, causing prices to fall sharply. In fact, some major producers reined in production amid collapsing prices last year. The surplus in lithium supply is projected to reach 30,000 metric tons globally in 2024, outpacing demand.
Outlook for 2024
While slower global growth could dampen commodities demand in 2024, the easing of interest rates by the Federal Reserve could be beneficial.
ING projects that gold will hit new highs in 2024, with potential rate cuts supporting prices.
From a geopolitical standpoint, escalating tensions in the Middle East could lead to stricter U.S. sanctions of oil in Iran and tighter supplies. OPEC+ policy, which has pushed for supply cuts, could also influence oil prices.
Commodities used in the green energy transition—such as nickel, copper, lithium, and zinc—have mostly bearish outlooks. A significant supply glut in nickel could depress prices, with a forecasted 239,000 metric ton surplus in 2024.
Copper, lithium, and zinc are also forecast to have surpluses next year.
However, taking a longer-term view, the IEA projects that copper production from existing mines and those in construction will meet 80% of climate goal requirements by 2030. For lithium, it will meet just half of these requirements in the green energy transition.


Who’s Building the Most Solar Energy?
This was originally posted on our Voronoi app. Download the app for free on iOS or Android and discover incredible data-driven charts from a variety of trusted sources.
In 2023, solar energy accounted for three-quarters of renewable capacity additions worldwide. Most of this growth occurred in Asia, the EU, and the U.S., continuing a trend observed over the past decade.
In this graphic, we illustrate the rise in installed solar photovoltaic (PV) capacity in China, the EU, and the U.S. between 2010 and 2022, measured in gigawatts (GW). Bruegel compiled the data..
Chinese Dominance
As of 2022, China’s total installed capacity stands at 393 GW, nearly double that of the EU’s 205 GW and surpassing the USA’s total of 113 GW by more than threefold in absolute terms.
| Installed solar capacity (GW) | China | EU27 | U.S. |
|---|---|---|---|
| 2022 | 393.0 | 205.5 | 113.0 |
| 2021 | 307.0 | 162.7 | 95.4 |
| 2020 | 254.0 | 136.9 | 76.4 |
| 2019 | 205.0 | 120.1 | 61.6 |
| 2018 | 175.3 | 104.0 | 52.0 |
| 2017 | 130.8 | 96.2 | 43.8 |
| 2016 | 77.8 | 91.5 | 35.4 |
| 2015 | 43.6 | 87.7 | 24.2 |
| 2014 | 28.4 | 83.6 | 18.1 |
| 2013 | 17.8 | 79.7 | 13.3 |
| 2012 | 6.7 | 71.1 | 8.6 |
| 2011 | 3.1 | 53.3 | 5.6 |
| 2010 | 1.0 | 30.6 | 3.4 |
Since 2017, China has shown a compound annual growth rate (CAGR) of approximately 25% in installed PV capacity, while the USA has seen a CAGR of 21%, and the EU of 16%.
Additionally, China dominates the production of solar power components, currently controlling around 80% of the world’s solar panel supply chain.
In 2022, China’s solar industry employed 2.76 million individuals, with manufacturing roles representing approximately 1.8 million and the remaining 918,000 jobs in construction, installation, and operations and maintenance.
The EU industry employed 648,000 individuals, while the U.S. reached 264,000 jobs.
According to the IEA, China accounts for almost 60% of new renewable capacity expected to become operational globally by 2028.
Despite the phasing out of national subsidies in 2020 and 2021, deployment of solar PV in China is accelerating. The country is expected to reach its national 2030 target for wind and solar PV installations in 2024, six years ahead of schedule.

-

 Markets6 days ago
Visualized: Interest Rate Forecasts for Advanced Economies
-

 Markets2 weeks ago
Economic Growth Forecasts for G7 and BRICS Countries in 2024
-

 Wealth2 weeks ago
Charted: Which City Has the Most Billionaires in 2024?
-

 Technology2 weeks ago
All of the Grants Given by the U.S. CHIPS Act
-

 Green2 weeks ago
The Carbon Footprint of Major Travel Methods
-

 United States1 week ago
Visualizing the Most Common Pets in the U.S.
-

 Culture1 week ago
The World’s Top Media Franchises by All-Time Revenue
-

 voronoi1 week ago
Best Visualizations of April on the Voronoi App