Mapped: Europe’s GDP Per Capita, by Country
The Growth of a $1,000 Equity Investment, by Stock Market
Mapped: The Most Valuable Company in Each Southeast Asian Country
Visualizing Global Inflation Forecasts (2024-2026)
The World’s Fastest Growing Emerging Markets (2024-2029 Forecast)
Countries With the Highest Rates of Crypto Ownership
Mapped: The Number of AI Startups By Country
All of the Grants Given by the U.S. CHIPS Act
Visualizing AI Patents by Country
How Tech Logos Have Evolved Over Time
Visualizing the Tax Burden of Every U.S. State
Charted: What Frustrates Americans About the Tax System
Ranked: The Top 20 Countries in Debt to China
Charted: Which Country Has the Most Billionaires in 2024?
Charted: Which City Has the Most Billionaires in 2024?
Life Expectancy by Region (1950-2050F)
What Causes Preventable Child Deaths?
The Cost of an EpiPen in Major Markets
Charted: Global Tobacco Use by Country and Sex
Visualized: What Lives in Your Gut Microbiome?
Who’s Building the Most Solar Energy?
Mapped: The Age of Energy Projects in Interconnection Queues, by State
Ranked: The Top 10 EV Battery Manufacturers in 2023
The World’s Biggest Nuclear Energy Producers
The World’s Biggest Oil Producers in 2023
The Largest Earthquakes in the New York Area (1970-2024)
Mapped: Average Wages Across Europe
Mapped: Asia’s Population Patterns by Density
A Map of Global Happiness By Country in 2024
Mapped: Population Growth by Region (1900-2050F)
Where the World’s Aluminum is Smelted, by Country
Visualizing Global Gold Production in 2023
Gold vs. S&P 500: Which Has Grown More Over Five Years?
Charted: The Value Gap Between the Gold Price and Gold Miners
How People Get Around in America, Europe, and Asia
The Carbon Footprint of Major Travel Methods
Ranking the Top 15 Countries by Carbon Tax Revenue
Ranked: The Countries With the Most Air Pollution in 2023
Top Countries By Forest Growth Since 2001
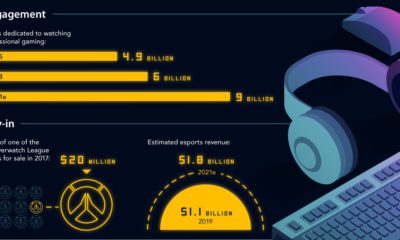
This infographic plots the journey of esports, from underground niche to a billion-dollar mainstream phenomenon—and it shows no signs of slowing down.
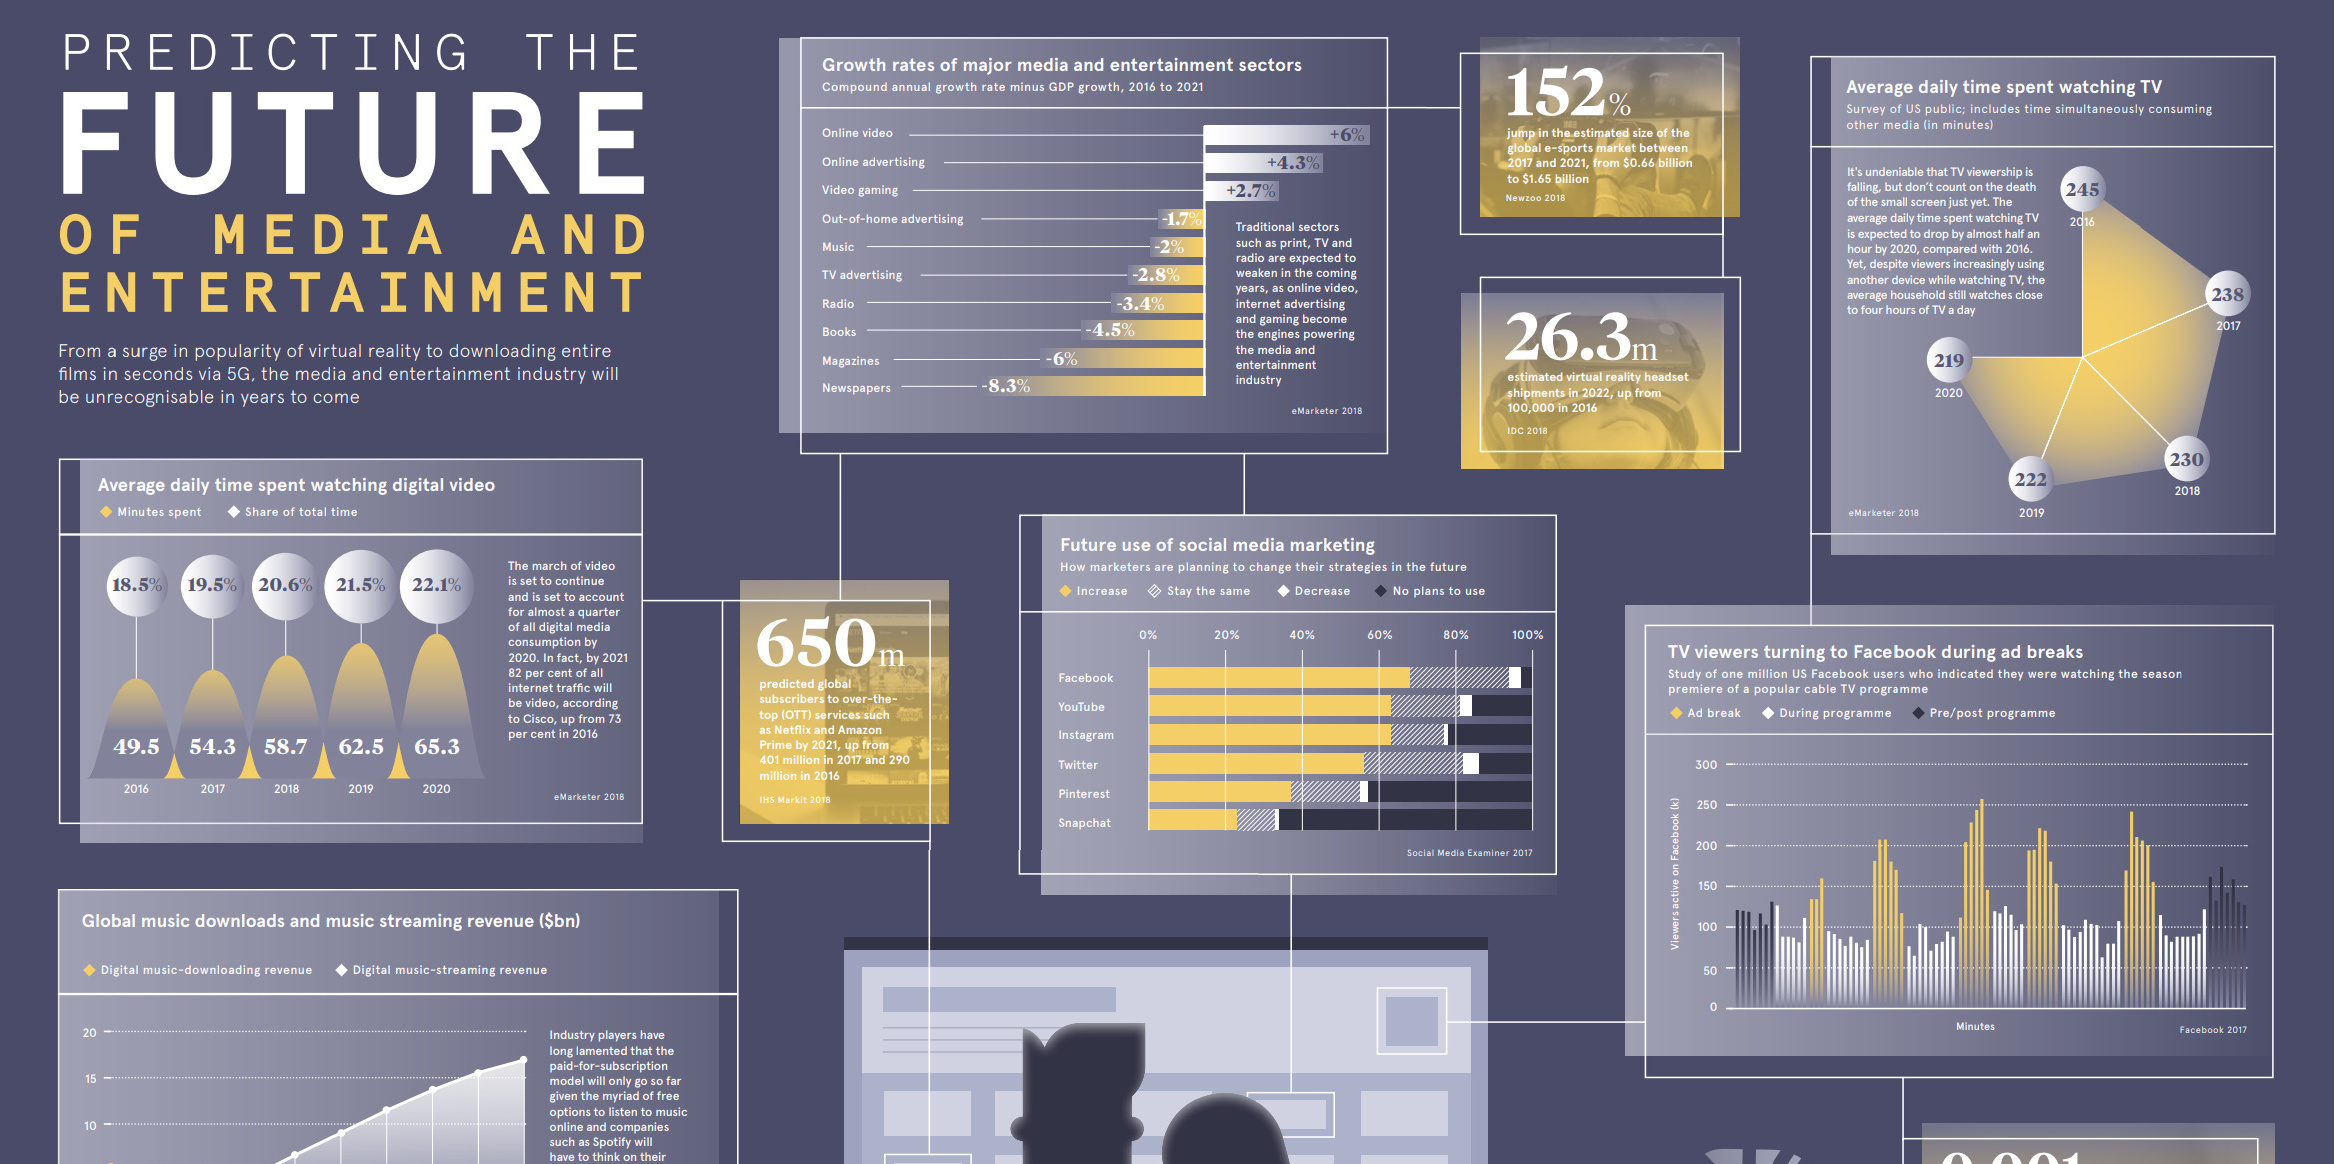
What technologies and trends are driving the future of media and entertainment? See the data in this large and information-packed infographic.
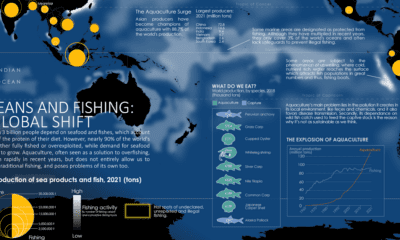
Where do our fish come from? This map charts ocean fishing activity and the amount of fish coming from aquaculture.
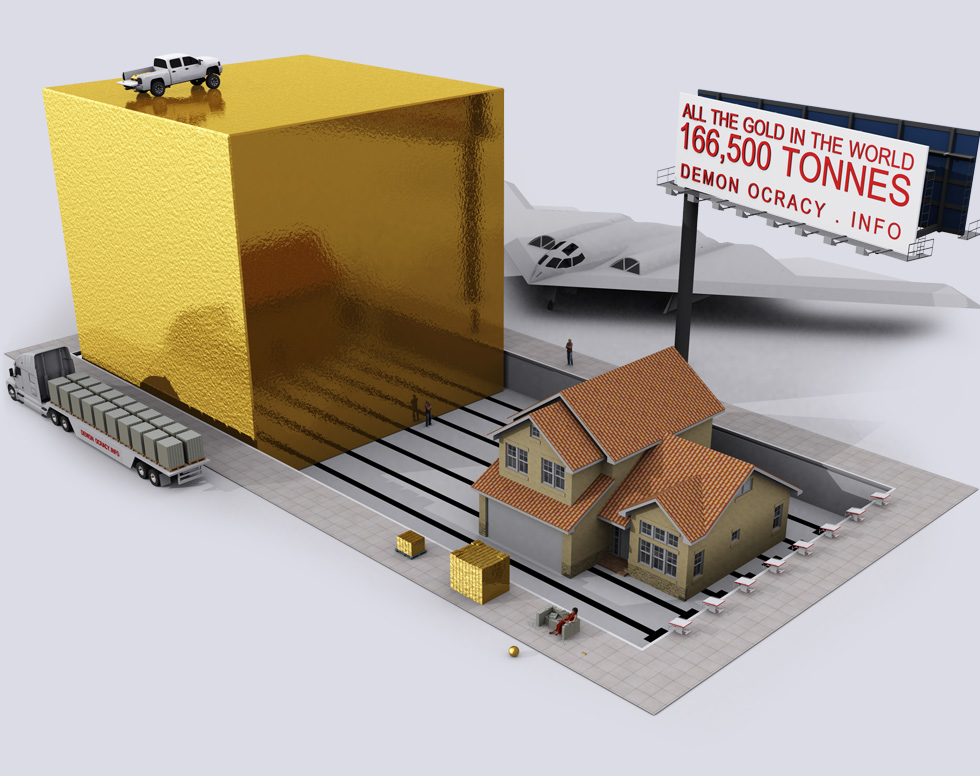
How rare is gold? This set of 3D visualizations show the world's gold in bullion bars.
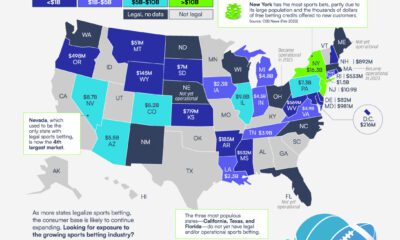
In 2022, legal sports betting in the U.S. totaled over $93 billion. Which states saw the most and least wagers? (Sponsored post)
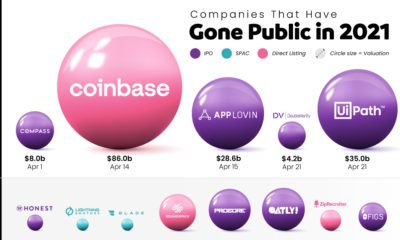
Tracking the companies that have gone public in 2021, their valuation, and how they did it.
Asia's digital economy is expanding quicker than ever, but cooperation between governments is needed to reduce barriers.
New VC+ subscribers get access to a special gift: a roundup of our best ever visualizations around population.
The history of Europe is breathtakingly complex, but this animation helps makes sense of 2,400 years of change on the European map.
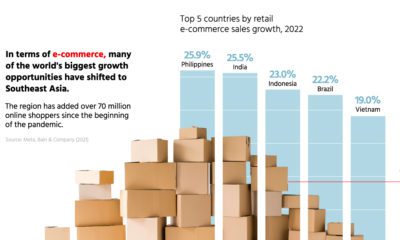
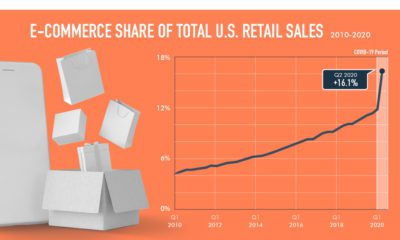
E-commerce is already massive, but COVID-19 has proven to be an unexpected catalyst in driving the use of digital marketplaces.


 Creator Program