Mapped: Europe’s GDP Per Capita, by Country
The Growth of a $1,000 Equity Investment, by Stock Market
Mapped: The Most Valuable Company in Each Southeast Asian Country
Visualizing Global Inflation Forecasts (2024-2026)
The World’s Fastest Growing Emerging Markets (2024-2029 Forecast)
Mapped: The Number of AI Startups By Country
All of the Grants Given by the U.S. CHIPS Act
Visualizing AI Patents by Country
How Tech Logos Have Evolved Over Time
Ranked: Semiconductor Companies by Industry Revenue Share
Charted: What Frustrates Americans About the Tax System
Ranked: The Top 20 Countries in Debt to China
Charted: Which Country Has the Most Billionaires in 2024?
Charted: Which City Has the Most Billionaires in 2024?
Charted: Who Has Savings in This Economy?
Life Expectancy by Region (1950-2050F)
What Causes Preventable Child Deaths?
The Cost of an EpiPen in Major Markets
Charted: Global Tobacco Use by Country and Sex
Visualized: What Lives in Your Gut Microbiome?
Who’s Building the Most Solar Energy?
Mapped: The Age of Energy Projects in Interconnection Queues, by State
Ranked: The Top 10 EV Battery Manufacturers in 2023
The World’s Biggest Nuclear Energy Producers
The World’s Biggest Oil Producers in 2023
The Largest Earthquakes in the New York Area (1970-2024)
Mapped: Average Wages Across Europe
Mapped: Asia’s Population Patterns by Density
A Map of Global Happiness By Country in 2024
Mapped: Population Growth by Region (1900-2050F)
Visualizing Global Gold Production in 2023
Gold vs. S&P 500: Which Has Grown More Over Five Years?
Charted: The Value Gap Between the Gold Price and Gold Miners
Charted: Global Uranium Reserves, by Country
The Carbon Footprint of Major Travel Methods
Ranking the Top 15 Countries by Carbon Tax Revenue
Ranked: The Countries With the Most Air Pollution in 2023
Top Countries By Forest Growth Since 2001
Ranked: Top Countries by Total Forest Loss Since 2001
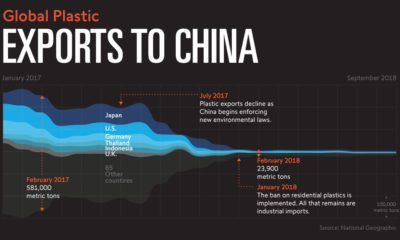
For decades, developed countries outsourced their recyclables to China. Now, they're on their own, and a multi-billion dollar opportunity has emerged.
With so much misinformation spreading on the pandemic, we've compiled a quality list of data-driven and unbiased COVID-19 resources for you to use.
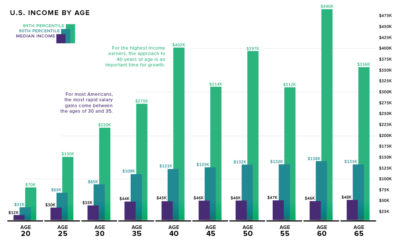
What is the relationship between age and income level? We visualize the data and compare it to commonly held beliefs on the topic.
Have you ever wondered how much copper is in an electric vehicle? This infographic shows the metal's properties as well as the quantity of copper used.
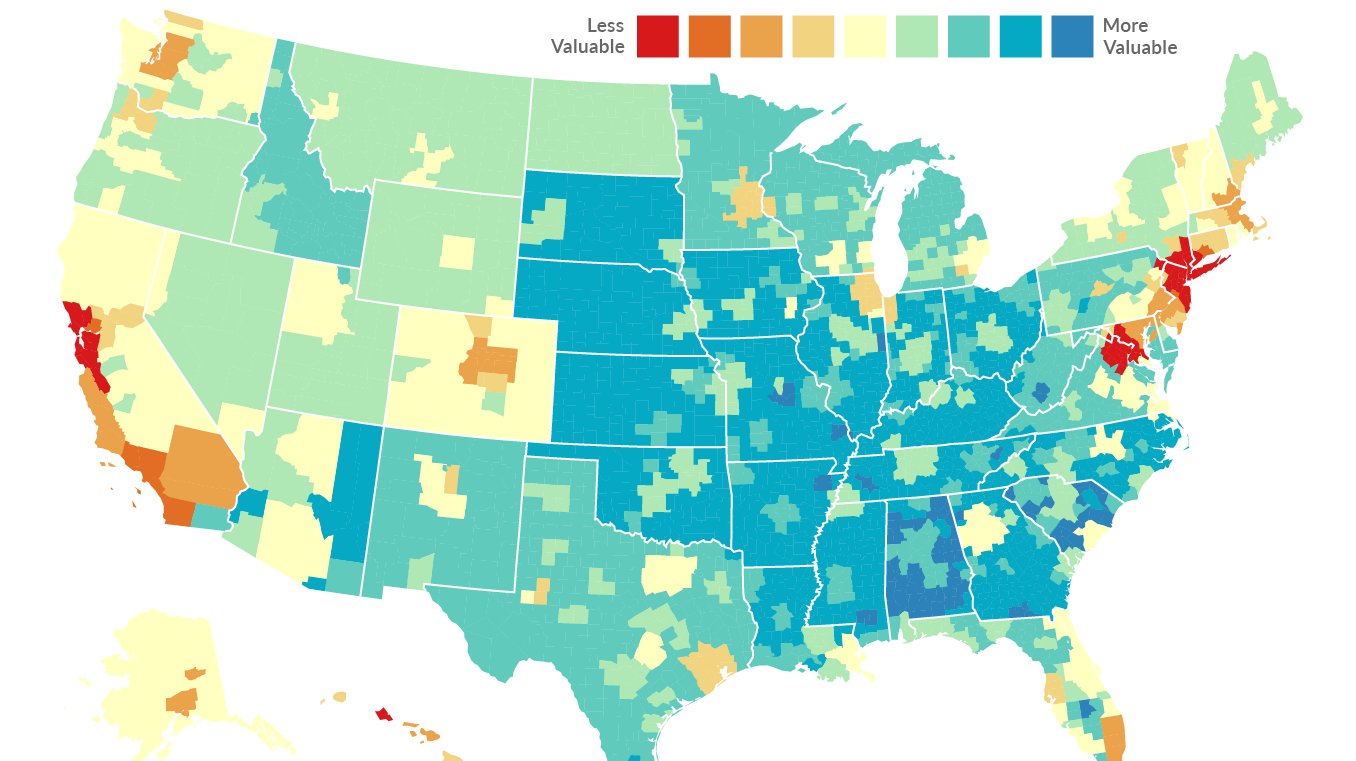
Every dollar spent is not equal. In some cities like NYC or SF, it will buy you far less - and in other places, a dollar...
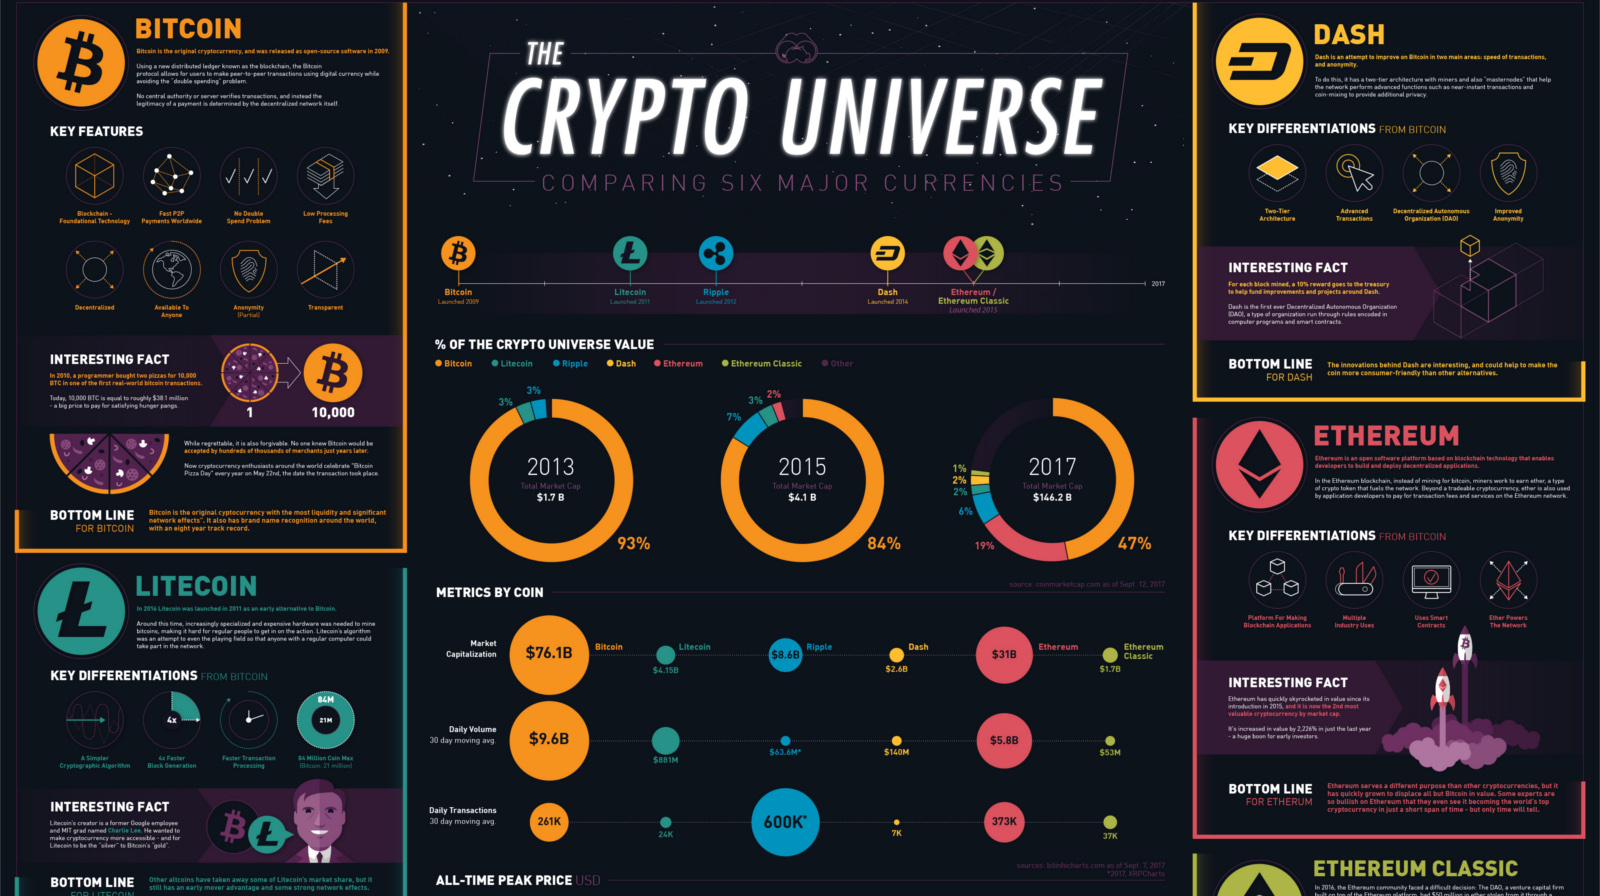
What's the difference between Bitcoin, Ethereum, Dash, Ripple, and Litecoin? This infographic breaks it all down, as well as many other key metrics.
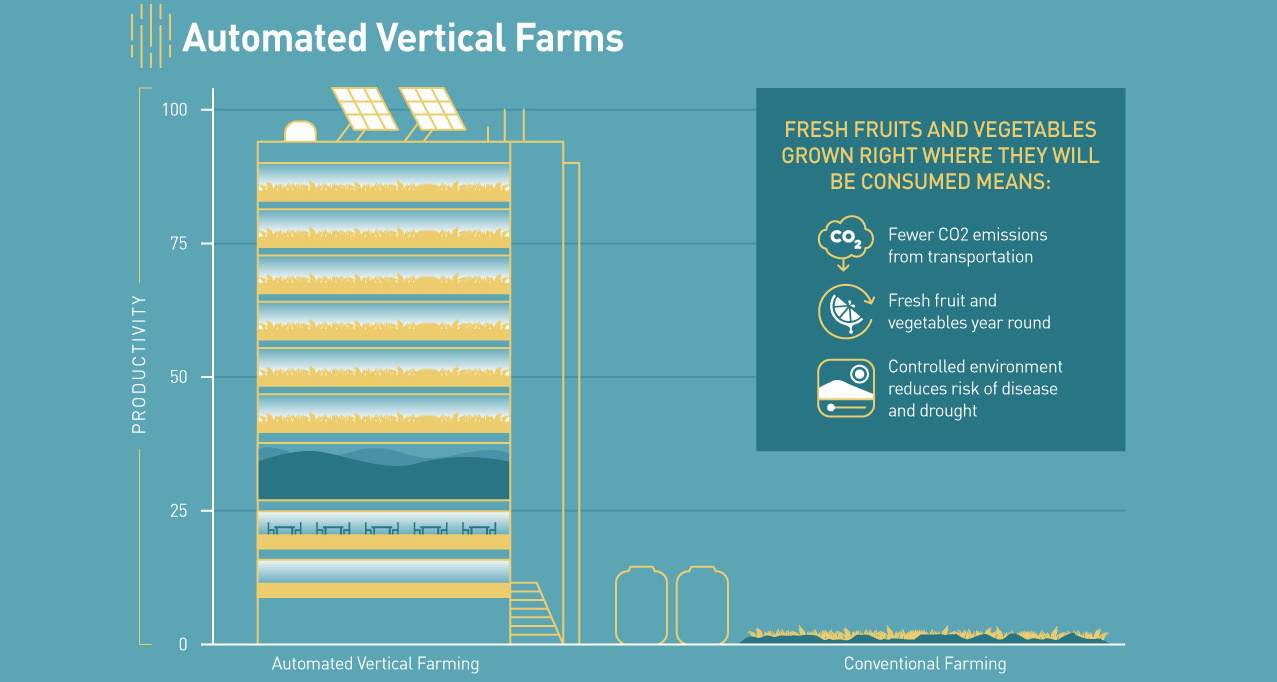
With a swelling global population, these 4 key food technologies will be vital for the future of food. We'll get more food with fewer resources.
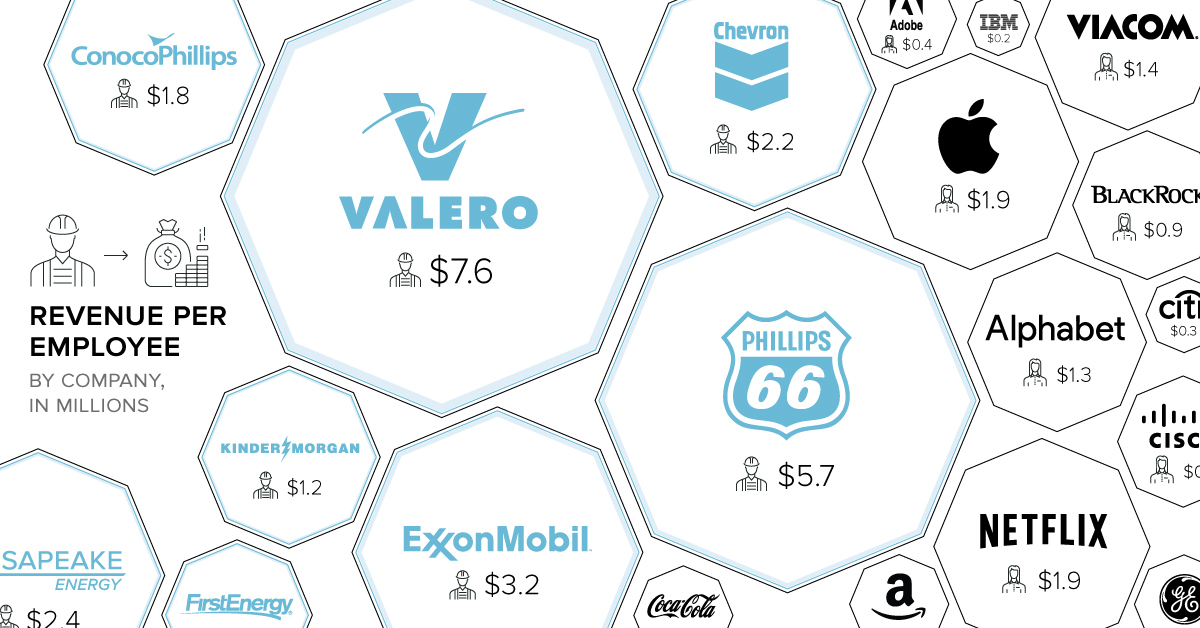
When it comes to revenue per employee, energy companies dominate. On average, oil companies bring in 2x more per employee than companies in other sectors.
The field has been narrowed for the French election, and now just Macron and Le Pen remain. See how they compare head-to-head in this infographic.
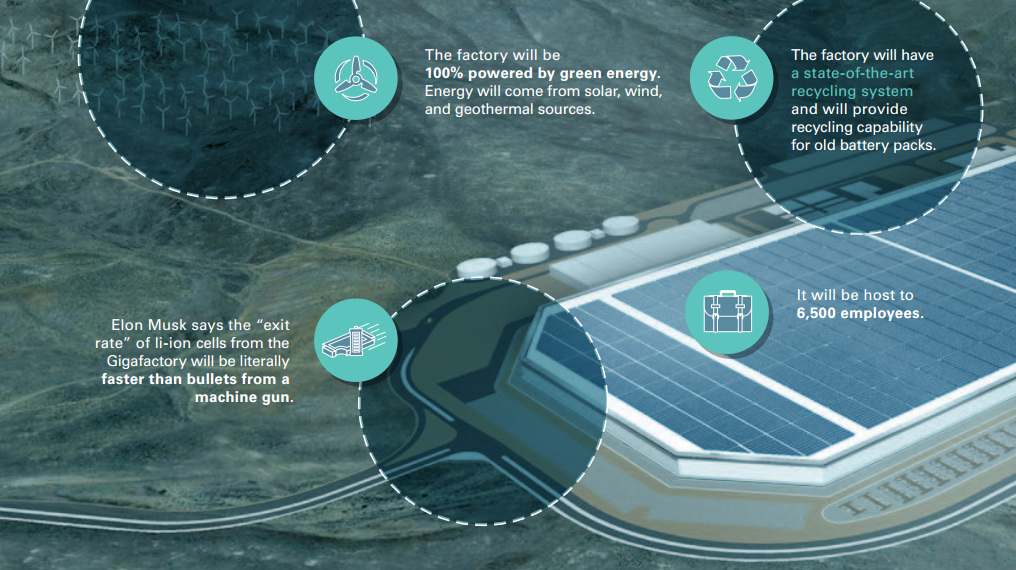
Tesla's giant production facility opens on July 29, and these 9 slides help to visualize the impact of the new Tesla Gigafactory.