Mapped: Europe’s GDP Per Capita, by Country
The Growth of a $1,000 Equity Investment, by Stock Market
Mapped: The Most Valuable Company in Each Southeast Asian Country
Visualizing Global Inflation Forecasts (2024-2026)
The World’s Fastest Growing Emerging Markets (2024-2029 Forecast)
Countries With the Highest Rates of Crypto Ownership
Mapped: The Number of AI Startups By Country
All of the Grants Given by the U.S. CHIPS Act
Visualizing AI Patents by Country
How Tech Logos Have Evolved Over Time
Charted: What Frustrates Americans About the Tax System
Ranked: The Top 20 Countries in Debt to China
Charted: Which Country Has the Most Billionaires in 2024?
Charted: Which City Has the Most Billionaires in 2024?
Charted: Who Has Savings in This Economy?
Life Expectancy by Region (1950-2050F)
What Causes Preventable Child Deaths?
The Cost of an EpiPen in Major Markets
Charted: Global Tobacco Use by Country and Sex
Visualized: What Lives in Your Gut Microbiome?
Who’s Building the Most Solar Energy?
Mapped: The Age of Energy Projects in Interconnection Queues, by State
Ranked: The Top 10 EV Battery Manufacturers in 2023
The World’s Biggest Nuclear Energy Producers
The World’s Biggest Oil Producers in 2023
The Largest Earthquakes in the New York Area (1970-2024)
Mapped: Average Wages Across Europe
Mapped: Asia’s Population Patterns by Density
A Map of Global Happiness By Country in 2024
Mapped: Population Growth by Region (1900-2050F)
Visualizing Global Gold Production in 2023
Gold vs. S&P 500: Which Has Grown More Over Five Years?
Charted: The Value Gap Between the Gold Price and Gold Miners
Charted: Global Uranium Reserves, by Country
The Carbon Footprint of Major Travel Methods
Ranking the Top 15 Countries by Carbon Tax Revenue
Ranked: The Countries With the Most Air Pollution in 2023
Top Countries By Forest Growth Since 2001
Ranked: Top Countries by Total Forest Loss Since 2001
This era of data abundance should be propelling humankind forward, but valuable insights are often lost in the noise. Data storytelling holds the key.
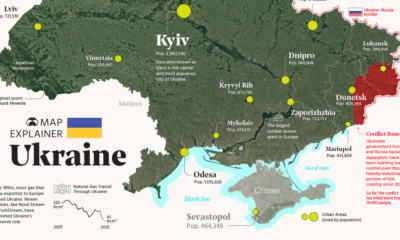
Ukraine has made the headlines due to the ongoing tensions with Russia. In this map infographic, we examine Ukraine from a structural point of view.
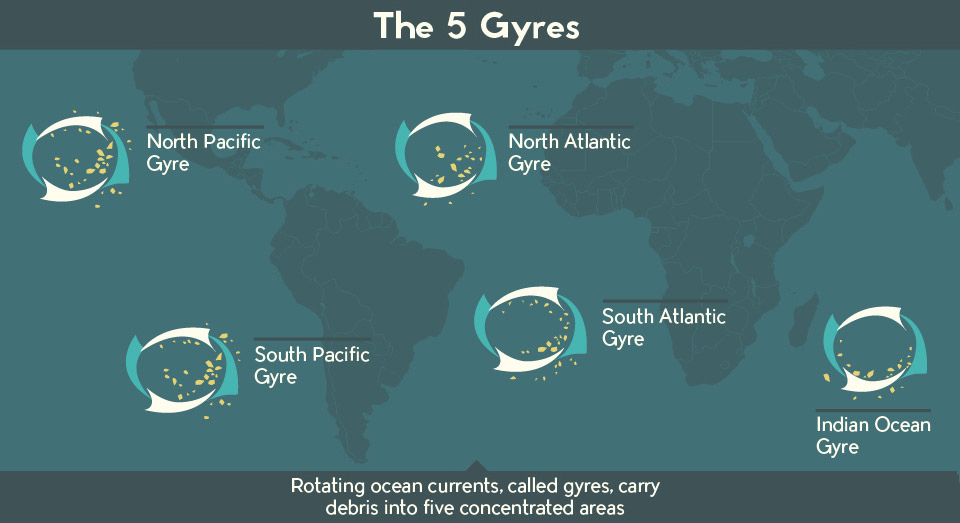
There is a staggering amount of plastic debris swirling around our oceans. This infographic and video help put this plastic problem in perspective.
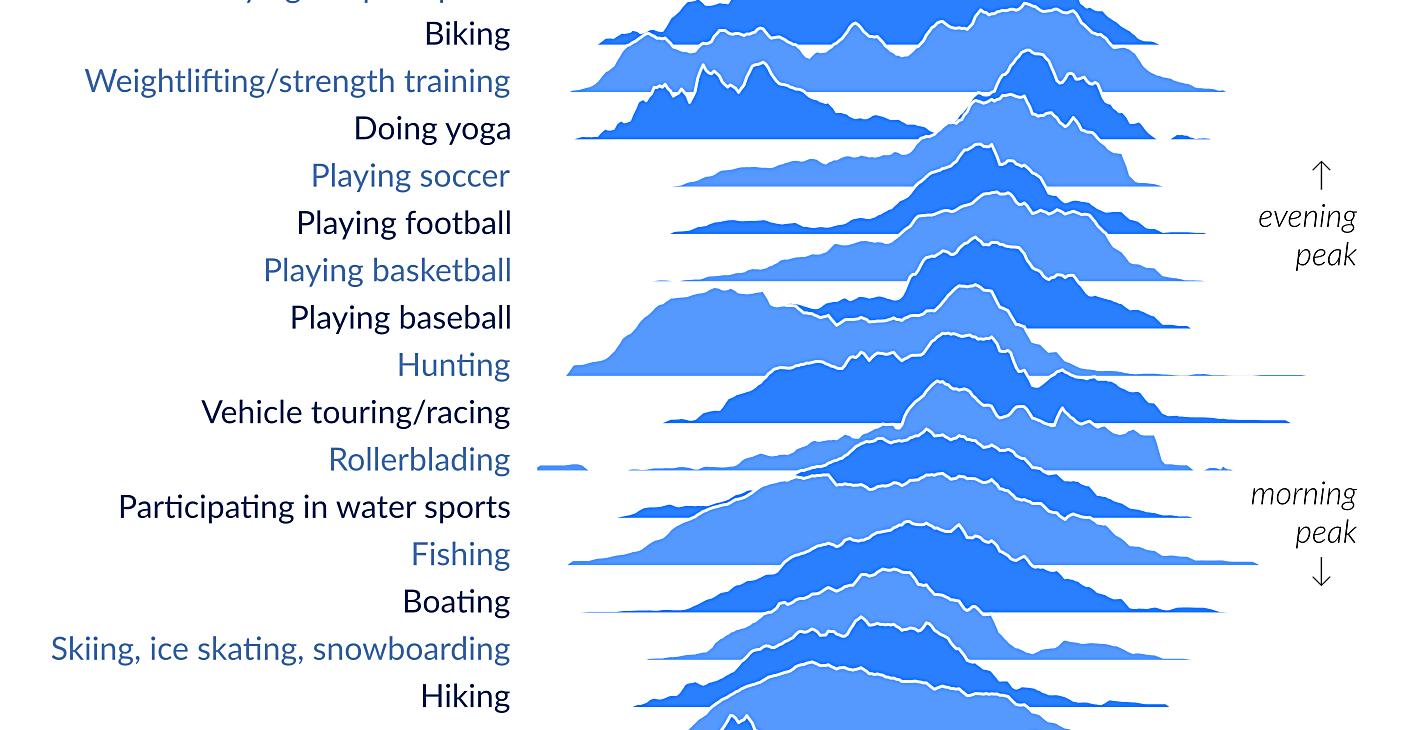
When are people doing activities like playing baseball or working out? This visualization shows how Americans spend free time, and when each activity peaks.
This graphic shows the 15 richest families in Asia. From energy to banking, these dynasties have built fortunes across many sectors.
Where you're from greatly influencers how you view the world. Here's a look at the core values in 94 different countries.
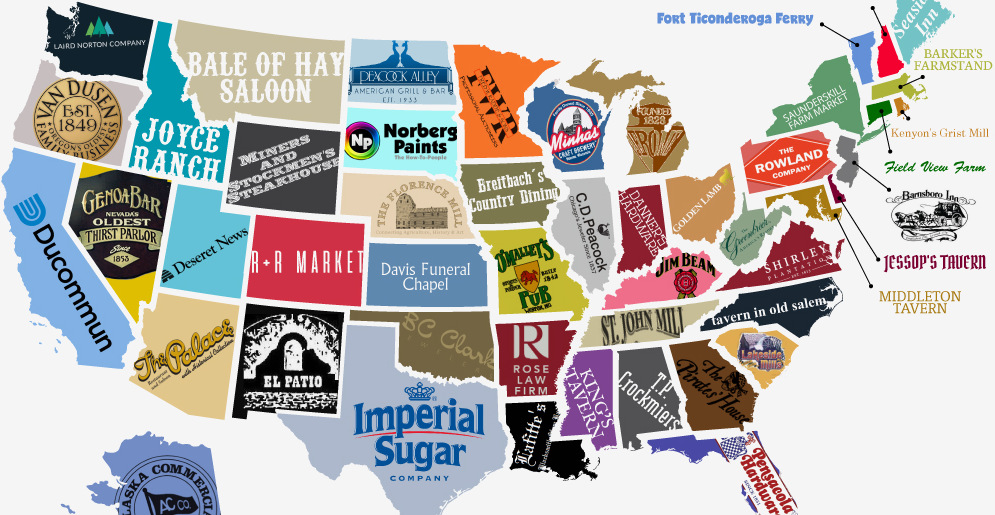
Is the oldest business in your state a well-known brand, or a mom-and-pop shop? This infographic shows the oldest company in each state in the U.S.
Why is payments startup Stripe worth $9B? Partly, because it's made it so easy to tap into the backend, allowing the creation of a massive Stripe...
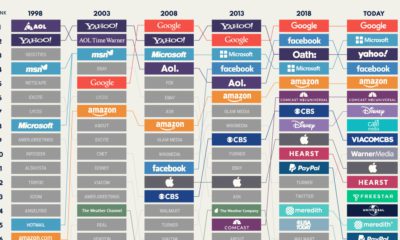
A lot has changed since Yahoo and AOL were the homepages of choice. This visualization looks at the largest internet giants in the U.S. since 1998.
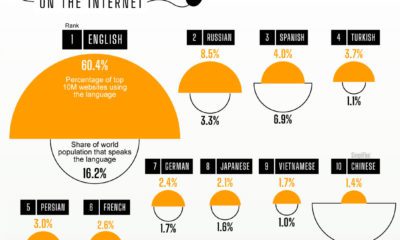
The internet is a truly global phenomenon, but a handful of languages dominate the digital world. Over 60% of the top 10 million webpages feature content...


 Creator Program