Visualizing Global Inflation Forecasts (2024-2026)
The World’s Fastest Growing Emerging Markets (2024-2029 Forecast)
The Most Valuable Companies in Major EU Economies
Visualized: Interest Rate Forecasts for Advanced Economies
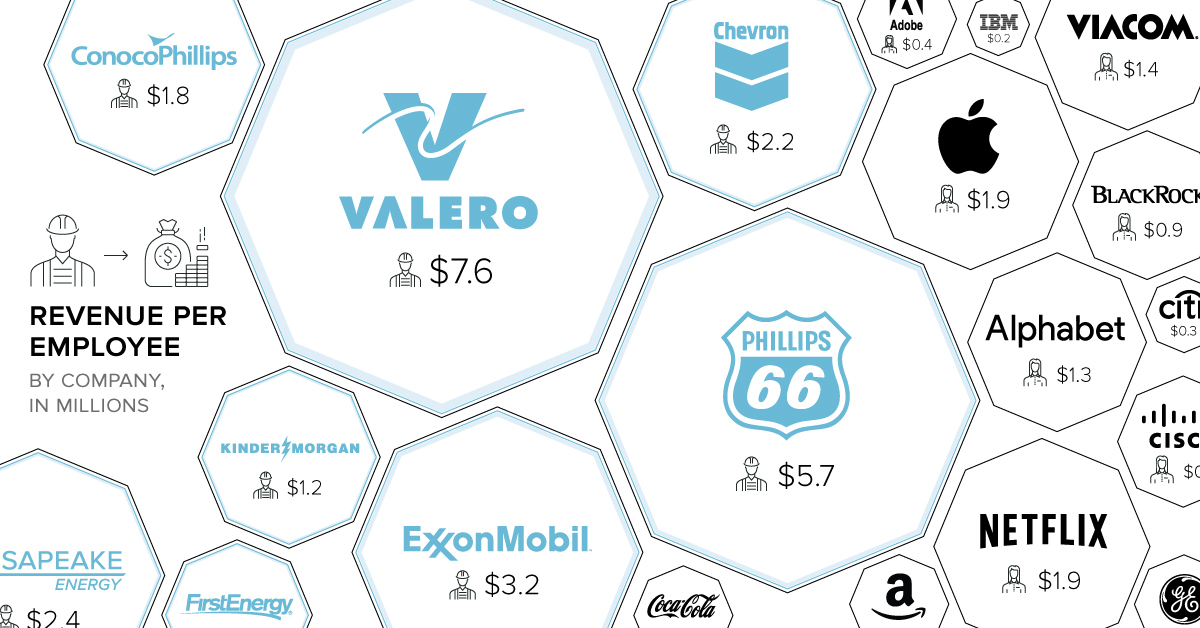
The Best U.S. Companies to Work for According to LinkedIn
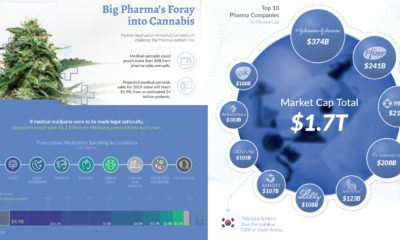
All of the Grants Given by the U.S. CHIPS Act
Visualizing AI Patents by Country
How Tech Logos Have Evolved Over Time
Ranked: Semiconductor Companies by Industry Revenue Share
The Stock Performance of U.S. Chipmakers So Far in 2024
Ranked: The Top 20 Countries in Debt to China
Charted: Which Country Has the Most Billionaires in 2024?
Charted: Which City Has the Most Billionaires in 2024?
Charted: Who Has Savings in This Economy?
How Debt-to-GDP Ratios Have Changed Since 2000
What Causes Preventable Child Deaths?
The Cost of an EpiPen in Major Markets
Charted: Global Tobacco Use by Country and Sex
Visualized: What Lives in Your Gut Microbiome?
Charted: Average Years Left to Live by Age
Mapped: The Age of Energy Projects in Interconnection Queues, by State
Ranked: The Top 10 EV Battery Manufacturers in 2023
The World’s Biggest Nuclear Energy Producers
The World’s Biggest Oil Producers in 2023
How Much Does the U.S. Depend on Russian Uranium?
The Largest Earthquakes in the New York Area (1970-2024)
Mapped: Average Wages Across Europe
Mapped: Asia’s Population Patterns by Density
A Map of Global Happiness By Country in 2024
Mapped: Population Growth by Region (1900-2050F)
Visualizing Global Gold Production in 2023
Gold vs. S&P 500: Which Has Grown More Over Five Years?
Charted: The Value Gap Between the Gold Price and Gold Miners
Charted: Global Uranium Reserves, by Country
The Carbon Footprint of Major Travel Methods
Ranking the Top 15 Countries by Carbon Tax Revenue
Ranked: The Countries With the Most Air Pollution in 2023
Top Countries By Forest Growth Since 2001
Ranked: Top Countries by Total Forest Loss Since 2001
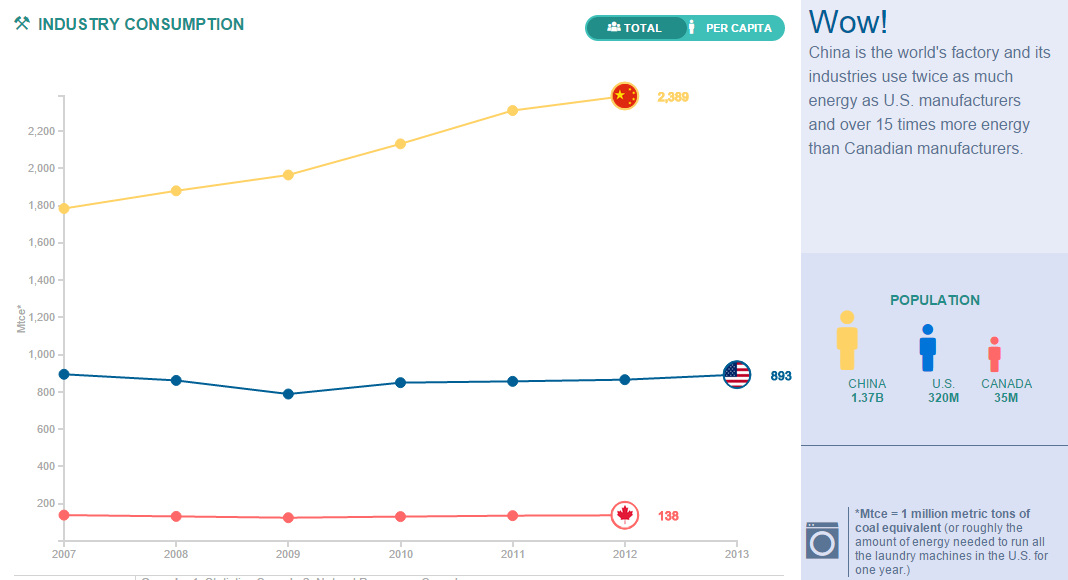
...40 percent since 2007. China is the world’s factory and its industries use twice as much energy as U.S. manufacturers and over 15 times more energy...
...percent at the end of 2021. But considering that top renewable countries such as Iceland, Paraguay, and Norway together only hosted just over one percent of...
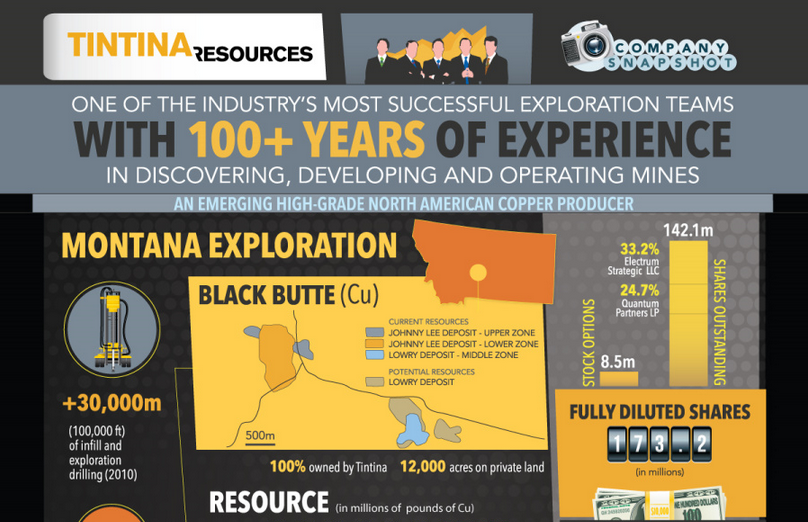
...they involve estimates of the mineralization that would be encountered, based on interpretation of drilling results and certain assumptions, if a deposit were developed and mined....
...is turning into a major driver of new meat demand. Since 2009, India’s annual disposable income has improved by 95 percent and meat consumption has increased...
...weekly Visual Capitalist feature on Fridays. The world’s largest companies have many similarities, but the size of their respective org charts is not necessarily one of...
...gives you exclusive access to extra visual content and insightful special features. It also gets you access to The Trendline, our new members-only graphic newsletter. So,...
...adds extra costs to the recycling process. On average, one in four items that arrive at an MRF are too contaminated to be recycled. Sorting inefficiency:...
...Score 1 Chr. Hansen Holding A/S Denmark Food or other Chemical Agents 82.99% 2 Kering SA France Apparel and Accessories 81.55% 3 Neste Corporation Finland Petroleum...
...Corporation 7 7. Hebrew University of Jerusalem 19 8. Ogeda SA 7 8. Roche 17 9. Sanofi 6 9. University of Connecticut 16 10. University of...
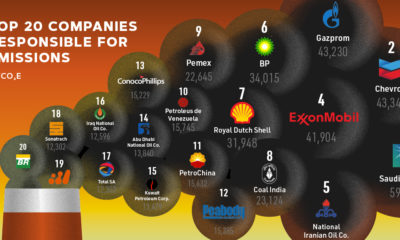
...National Oil Co. 🇦🇪 UAE State-owned 13,840 Kuwait Petroleum Corp. 🇰🇼 Kuwait State-owned 13,479 Iraq National Oil Co. 🇮🇶 Iraq State-owned 12,596 Total SA 🇫🇷 France...