Mapped: Europe’s GDP Per Capita, by Country
The Growth of a $1,000 Equity Investment, by Stock Market
Mapped: The Most Valuable Company in Each Southeast Asian Country
Visualizing Global Inflation Forecasts (2024-2026)
The World’s Fastest Growing Emerging Markets (2024-2029 Forecast)
Mapped: The Number of AI Startups By Country
All of the Grants Given by the U.S. CHIPS Act
Visualizing AI Patents by Country
How Tech Logos Have Evolved Over Time
Ranked: Semiconductor Companies by Industry Revenue Share
Ranked: The Top 20 Countries in Debt to China
Charted: Which Country Has the Most Billionaires in 2024?
Charted: Which City Has the Most Billionaires in 2024?
Charted: Who Has Savings in This Economy?
How Debt-to-GDP Ratios Have Changed Since 2000
Life Expectancy by Region (1950-2050F)
What Causes Preventable Child Deaths?
The Cost of an EpiPen in Major Markets
Charted: Global Tobacco Use by Country and Sex
Visualized: What Lives in Your Gut Microbiome?
Who’s Building the Most Solar Energy?
Mapped: The Age of Energy Projects in Interconnection Queues, by State
Ranked: The Top 10 EV Battery Manufacturers in 2023
The World’s Biggest Nuclear Energy Producers
The World’s Biggest Oil Producers in 2023
The Largest Earthquakes in the New York Area (1970-2024)
Mapped: Average Wages Across Europe
Mapped: Asia’s Population Patterns by Density
A Map of Global Happiness By Country in 2024
Mapped: Population Growth by Region (1900-2050F)
Visualizing Global Gold Production in 2023
Gold vs. S&P 500: Which Has Grown More Over Five Years?
Charted: The Value Gap Between the Gold Price and Gold Miners
Charted: Global Uranium Reserves, by Country
The Carbon Footprint of Major Travel Methods
Ranking the Top 15 Countries by Carbon Tax Revenue
Ranked: The Countries With the Most Air Pollution in 2023
Top Countries By Forest Growth Since 2001
Ranked: Top Countries by Total Forest Loss Since 2001
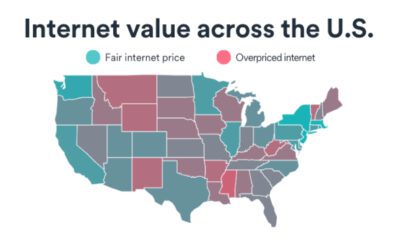
Which U.S. state has the best internet value? Browse this interactive map to see where states rank on the Internet Value Index.
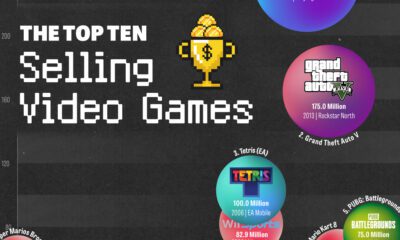
This chart shows the top ten best selling video games, ranked by software units sold. Six of them have been released in the last 12 years.
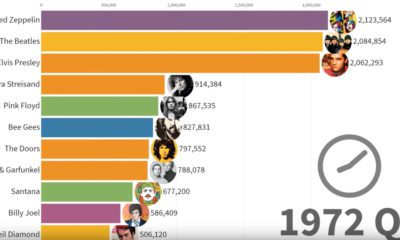
This mesmerizing video visualizes the best-selling music artists from 1969 to 2019 and highlights how long they held onto the top spot.
See the most popular, most discussed, and most liked visualizations on our new data storytelling app Voronoi in December.
Now, you can explore even more data-driven visualizations from the global talent in our newly launched Creator Program.
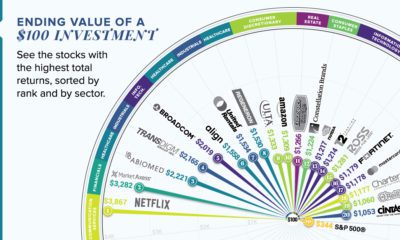
The highest one-year return among the top S&P 500 stocks from 1980 to 2022 was a staggering 2,620%. Which stocks top the ranks?
This graphic reveals the best-performing stocks over the last 10 years, and shows how much an initial $100 investment would be worth today.
We visualized the results of a LinkedIn study on the best U.S. companies to work for in 2024.
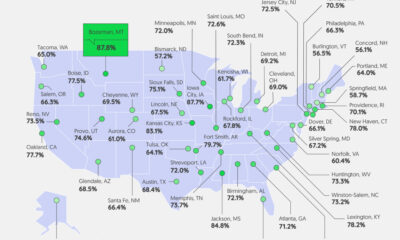
Good pay can help manage first-job worries. We visualize how geography affects entry-level pay across the U.S.
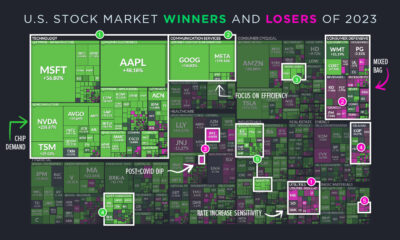
Here are the best performing sectors of 2023—and the ones that fell behind—in a year defined by AI, high interest rates, and resilience.


 Creator Program