Mapped: Europe’s GDP Per Capita, by Country
The Growth of a $1,000 Equity Investment, by Stock Market
Mapped: The Most Valuable Company in Each Southeast Asian Country
Visualizing Global Inflation Forecasts (2024-2026)
The World’s Fastest Growing Emerging Markets (2024-2029 Forecast)
Countries With the Highest Rates of Crypto Ownership
Mapped: The Number of AI Startups By Country
All of the Grants Given by the U.S. CHIPS Act
Visualizing AI Patents by Country
How Tech Logos Have Evolved Over Time
Visualizing the Tax Burden of Every U.S. State
Charted: What Frustrates Americans About the Tax System
Ranked: The Top 20 Countries in Debt to China
Charted: Which Country Has the Most Billionaires in 2024?
Charted: Which City Has the Most Billionaires in 2024?
Which Countries Have the Highest Infant Mortality Rates?
Life Expectancy by Region (1950-2050F)
What Causes Preventable Child Deaths?
The Cost of an EpiPen in Major Markets
Charted: Global Tobacco Use by Country and Sex
Who’s Building the Most Solar Energy?
Mapped: The Age of Energy Projects in Interconnection Queues, by State
Ranked: The Top 10 EV Battery Manufacturers in 2023
The World’s Biggest Nuclear Energy Producers
The World’s Biggest Oil Producers in 2023
Mapped: U.S. Immigrants by Region
Mapped: Southeast Asia’s GDP Per Capita, by Country
The Largest Earthquakes in the New York Area (1970-2024)
Mapped: Average Wages Across Europe
Mapped: Asia’s Population Patterns by Density
Visualizing Copper Production by Country in 2023
Where the World’s Aluminum is Smelted, by Country
Visualizing Global Gold Production in 2023
Gold vs. S&P 500: Which Has Grown More Over Five Years?
How People Get Around in America, Europe, and Asia
The Carbon Footprint of Major Travel Methods
Ranking the Top 15 Countries by Carbon Tax Revenue
Ranked: The Countries With the Most Air Pollution in 2023
Top Countries By Forest Growth Since 2001
This infographic examines 50 years of data to highlight a clear visual trend: recessions are preceded by a cyclical low in unemployment.
Despite having 4% of the world's population, the value of U.S. equities still make up over 40% of the global total.
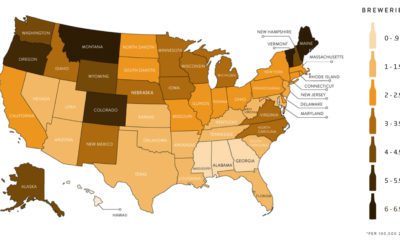
This infographic takes a closer look at the craft beer revolution sweeping across the U.S,. and its far reaching economic impact.
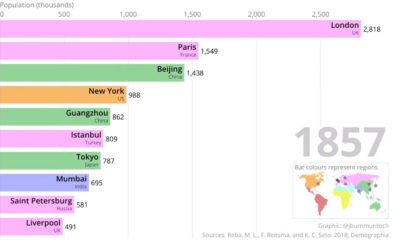
This two-minute animation shows changes in the last 500 years of historical rankings for the world's 10 most populous cities.
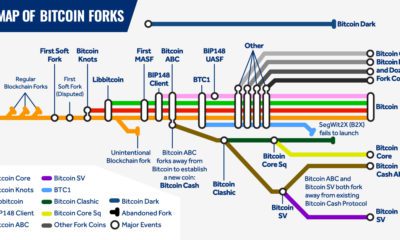
Bitcoin forks play a key role in Bitcoin's evolution as a blockchain. While some have sparked controversy, most Bitcoin forks have been a sign of growth.
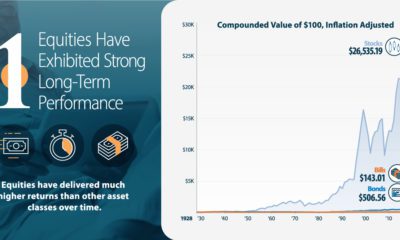
With life expectancies increasing, will you outlive your savings? Learn how allocating more of your portfolio to equities may reduce longevity risk.
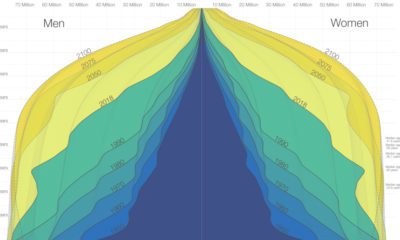
The world is in the midst of a notable demographic transition. Here's how the world population pyramid will change as we close in on the year...
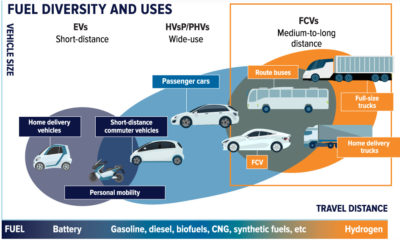
Hydrogen and fuel cell technology harnesses the power of the universe to bring clean energy on Earth. Here is its potential.
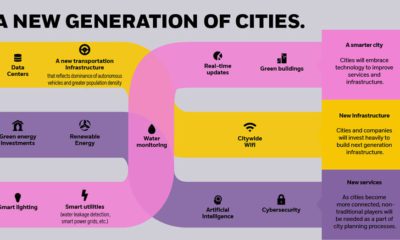
By 2050, there will be 2.5 billion more people living in cities than today. How is rapid urbanization set to impact investors and the global economy?v
Mineral exploration produces massive amounts of data. With AI, geologists can produce geological insights from this data to make the next discovery.