Markets
Mapped: The World’s Biggest Importers in 2018
Mapped: The World’s Biggest Importers in 2018
If a country’s economy was entirely self-sufficient and independent, it wouldn’t ever need to import goods from elsewhere.
While the prospect of insulating yourself from the turbulence of global markets may sound alluring at first glance, it would come with considerable caveats, risks, and downsides.
Not only would it mean missing out on the world’s best foreign products, but it would likely translate to incredibly expensive goods domestically. Meanwhile, highly specialized products would be unavailable, and unforeseen events (natural disasters, labor strikes, droughts, etc.) would have the potential to disrupt supply chains in ways that lead to economic chaos.
For these reasons — along with many others — most economies opt to import in billions of dollars of goods each year from their international trading partners.
Which Countries Import the Most Goods?
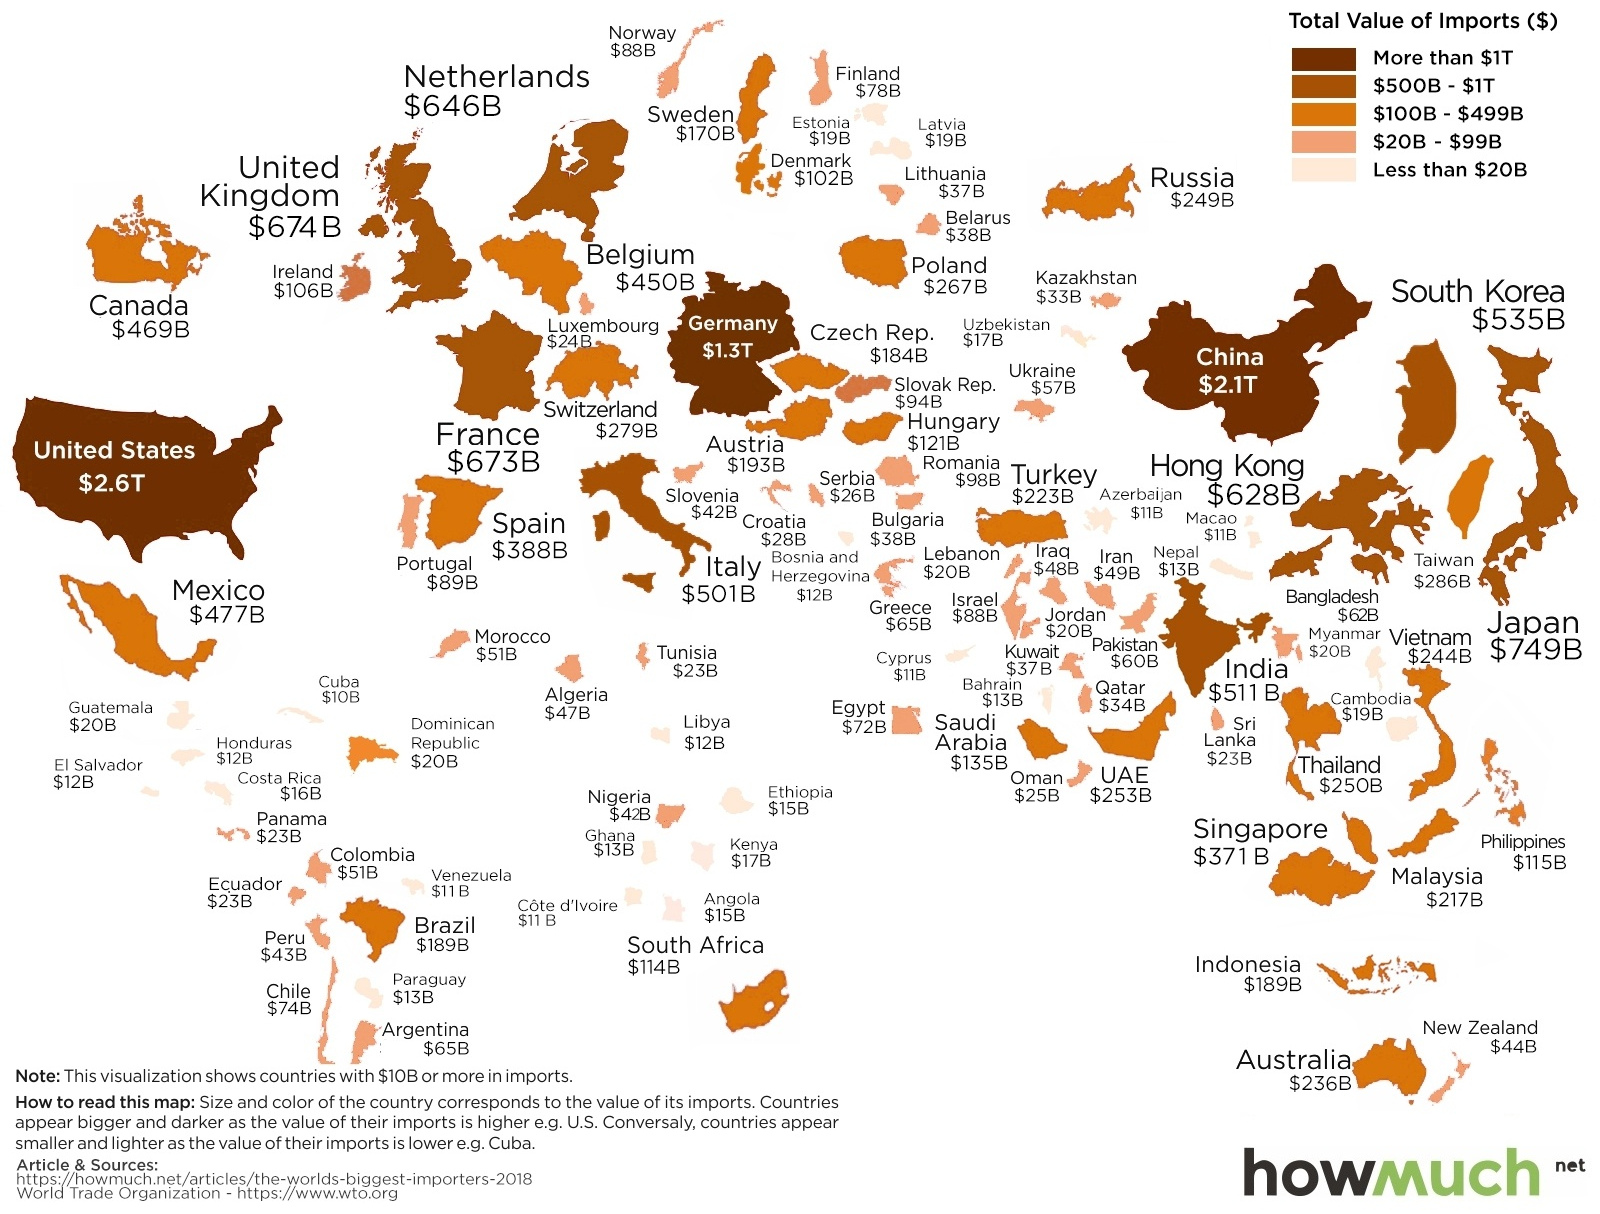
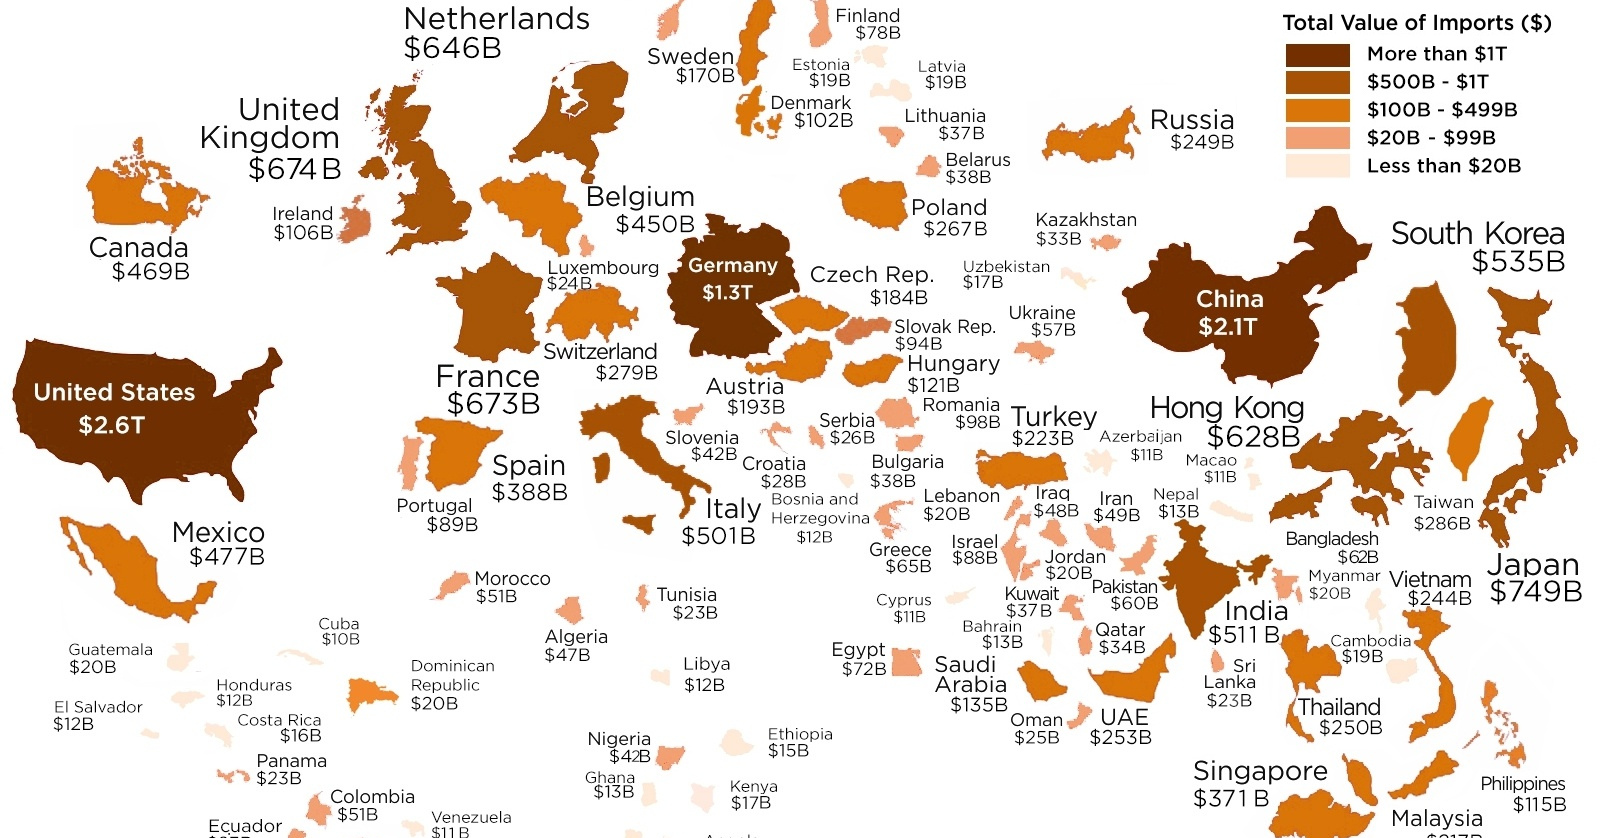
Today’s map comes from HowMuch.net, and it resizes countries based on the value of their annual imports in 2018. The visualization is based on data from the World Trade Organization.
Let’s take a look at the 15 countries that are the world’s biggest importers:
| Rank | Country | Imports (2018, $M) | Share of Global Total |
|---|---|---|---|
| #1 | 🇺🇸 United States | $2,614,327 | 13.2% |
| #2 | 🇨🇳 China | $2,135,905 | 10.8% |
| #3 | 🇩🇪 Germany | $1,285,644 | 6.5% |
| #4 | 🇯🇵 Japan | $748,735 | 3.8% |
| #5 | 🇬🇧 United Kingdom | $673,549 | 3.4% |
| #6 | 🇫🇷 France | $672,593 | 3.4% |
| #7 | 🇳🇱 Netherlands | $646,029 | 3.3% |
| #8 | 🇭🇰 Hong Kong, China | $627,517 | 3.2% |
| #9 | 🇰🇷 Korea, Republic of | $535,202 | 2.7% |
| #10 | 🇮🇳 India | $510,665 | 2.6% |
| #11 | 🇮🇹 Italy | $500,795 | 2.5% |
| #12 | 🇲🇽 Mexico | $476,569 | 2.4% |
| #13 | 🇨🇦 Canada | $469,000 | 2.4% |
| #14 | 🇧🇪 Belgium | $450,116 | 2.3% |
| #15 | 🇪🇸 Spain | $388,044 | 2.0% |
In combination, economies around the world import a total of $19.9 trillion in goods each year.
The world’s largest single importer is the United States, with a 13.4% share of global imports equal to $2.6 trillion of goods. Following the U.S. are two other significant economies, each which import over $1 trillion in goods every year: China ($2.1 trillion), and Germany ($1.3 trillion).
Finally, it’s worth noting that if the numbers for the European Union (28) were combined into a single entity, it’d be the world’s biggest importer by far with nearly $6.5 trillion of imports.


Markets
Mapped: Europe’s GDP Per Capita, by Country
Which European economies are richest on a GDP per capita basis? This map shows the results for 44 countries across the continent.


Mapped: Europe’s GDP Per Capita, by Country (2024)
This was originally posted on our Voronoi app. Download the app for free on iOS or Android and discover incredible data-driven charts from a variety of trusted sources.
Europe is home to some of the largest and most sophisticated economies in the world. But how do countries in the region compare with each other on a per capita productivity basis?
In this map, we show Europe’s GDP per capita levels across 44 nations in current U.S. dollars. Data for this visualization and article is sourced from the International Monetary Fund (IMF) via their DataMapper tool, updated April 2024.
Europe’s Richest and Poorest Nations, By GDP Per Capita
Luxembourg, Ireland, and Switzerland, lead the list of Europe’s richest nations by GDP per capita, all above $100,000.
| Rank | Country | GDP Per Capita (2024) |
|---|---|---|
| 1 | 🇱🇺 Luxembourg | $131,380 |
| 2 | 🇮🇪 Ireland | $106,060 |
| 3 | 🇨🇭 Switzerland | $105,670 |
| 4 | 🇳🇴 Norway | $94,660 |
| 5 | 🇮🇸 Iceland | $84,590 |
| 6 | 🇩🇰 Denmark | $68,900 |
| 7 | 🇳🇱 Netherlands | $63,750 |
| 8 | 🇸🇲 San Marino | $59,410 |
| 9 | 🇦🇹 Austria | $59,230 |
| 10 | 🇸🇪 Sweden | $58,530 |
| 11 | 🇧🇪 Belgium | $55,540 |
| 12 | 🇫🇮 Finland | $55,130 |
| 13 | 🇩🇪 Germany | $54,290 |
| 14 | 🇬🇧 UK | $51,070 |
| 15 | 🇫🇷 France | $47,360 |
| 16 | 🇦🇩 Andorra | $44,900 |
| 17 | 🇲🇹 Malta | $41,740 |
| 18 | 🇮🇹 Italy | $39,580 |
| 19 | 🇨🇾 Cyprus | $37,150 |
| 20 | 🇪🇸 Spain | $34,050 |
| 21 | 🇸🇮 Slovenia | $34,030 |
| 22 | 🇪🇪 Estonia | $31,850 |
| 23 | 🇨🇿 Czech Republic | $29,800 |
| 24 | 🇵🇹 Portugal | $28,970 |
| 25 | 🇱🇹 Lithuania | $28,410 |
| 26 | 🇸🇰 Slovakia | $25,930 |
| 27 | 🇱🇻 Latvia | $24,190 |
| 28 | 🇬🇷 Greece | $23,970 |
| 29 | 🇭🇺 Hungary | $23,320 |
| 30 | 🇵🇱 Poland | $23,010 |
| 31 | 🇭🇷 Croatia | $22,970 |
| 32 | 🇷🇴 Romania | $19,530 |
| 33 | 🇧🇬 Bulgaria | $16,940 |
| 34 | 🇷🇺 Russia | $14,390 |
| 35 | 🇹🇷 Türkiye | $12,760 |
| 36 | 🇲🇪 Montenegro | $12,650 |
| 37 | 🇷🇸 Serbia | $12,380 |
| 38 | 🇦🇱 Albania | $8,920 |
| 39 | 🇧🇦 Bosnia & Herzegovina | $8,420 |
| 40 | 🇲🇰 North Macedonia | $7,690 |
| 41 | 🇧🇾 Belarus | $7,560 |
| 42 | 🇲🇩 Moldova | $7,490 |
| 43 | 🇽🇰 Kosovo | $6,390 |
| 44 | 🇺🇦 Ukraine | $5,660 |
| N/A | 🇪🇺 EU Average | $44,200 |
Note: Figures are rounded.
Three Nordic countries (Norway, Iceland, Denmark) also place highly, between $70,000-90,000. Other Nordic peers, Sweden and Finland rank just outside the top 10, between $55,000-60,000.
Meanwhile, Europe’s biggest economies in absolute terms, Germany, UK, and France, rank closer to the middle of the top 20, with GDP per capitas around $50,000.
Finally, at the end of the scale, Eastern Europe as a whole tends to have much lower per capita GDPs. In that group, Ukraine ranks last, at $5,660.
A Closer Look at Ukraine
For a broader comparison, Ukraine’s per capita GDP is similar to Iran ($5,310), El Salvador ($5,540), and Guatemala ($5,680).
According to experts, Ukraine’s economy has historically underperformed to expectations. After the fall of the Berlin Wall, the economy contracted for five straight years. Its transition to a Western, liberalized economic structure was overshadowed by widespread corruption, a limited taxpool, and few revenue sources.
Politically, its transformation from authoritarian regime to civil democracy has proved difficult, especially when it comes to institution building.
Finally, after the 2022 invasion of the country, Ukraine’s GDP contracted by 30% in a single year—the largest loss since independence. Large scale emigration—to the tune of six million refugees—is also playing a role.
Despite these challenges, the country’s economic growth has somewhat stabilized while fighting continues.

-

 Markets5 days ago
The World’s Fastest Growing Emerging Markets (2024-2029 Forecast)
-

 Technology2 weeks ago
All of the Grants Given by the U.S. CHIPS Act
-

 Green2 weeks ago
The Carbon Footprint of Major Travel Methods
-

 United States2 weeks ago
Visualizing the Most Common Pets in the U.S.
-

 Culture2 weeks ago
The World’s Top Media Franchises by All-Time Revenue
-

 Visual Capitalist1 week ago
Best Visualizations of April on the Voronoi App
-

 Wealth1 week ago
Charted: Which Country Has the Most Billionaires in 2024?
-

 Markets1 week ago
The Top Private Equity Firms by Country