Technology
The Rise of the ICO, and What It Could Mean for Venture Capital
For any ambitious startup founder, the traditional route to funding goes through angel/seed investors and then eventually to the big venture capitalists.
The sophisticated players in this funding landscape make significant amounts of dough by spotting game-changing opportunities in their early stages, and then applying their insights, connections, and experience to these startups to make them financially viable. Finally, they guide the successful company to an exit, take their returns, and then distribute to the partners.
But what if startups, especially those related to the blockchain, were able to raise money from everyone simultaneously? What if the traditional gatekeepers didn’t matter as much?
ICOs vs. Venture
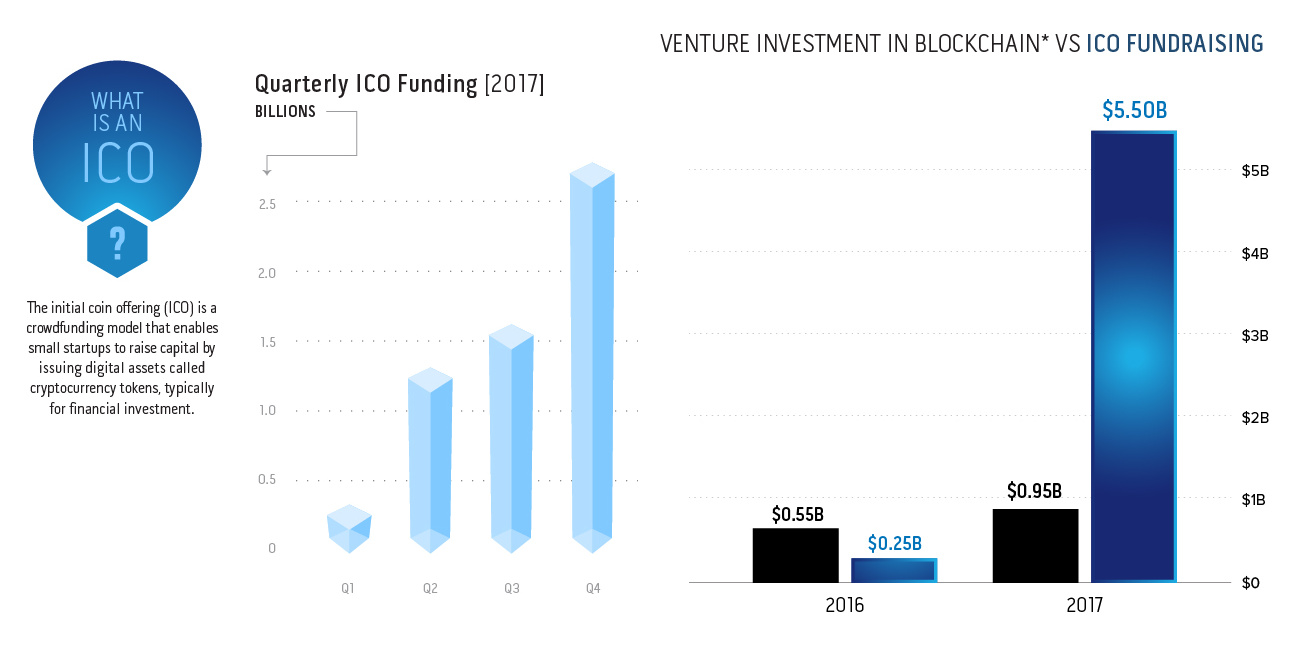
Last year, it became clear that Initial Coin Offerings (ICOs) would start to challenge traditional venture capital, as funding raised through them exploded by over 20x.
Today’s infographic from Vanbex Ventures shows key statistics around this phenomenon, as well as the evolving reception from venture capital and institutional investors.

Needless to say, the relationship between ICOs and venture capital is a conflicted one.
On one hand, it represents the inevitable disruption of many different elements of the traditional business model. On the other hand, the ICO space is too tantalizing to ignore: cryptocurrencies are worth nearly $0.5 trillion, and those that put money in early saw returns in the quadruple digits.
Getting Onboard?
The $5.3 billion boom in ICOs in 2017 had no problems surpassing traditional early-stage venture capital for blockchain-adjacent startups, which only saw $0.95 billion in funding.
While most VCs were slow to adapt, there have been increasing signs of interest – even despite the existing regulatory concerns. In particular, the idea of additional liquidity appeals to these investors since tokens can be sold at any point. This gives an advantage over traditional models, where a liquidity event such as an IPO or acquisition is necessary.
As a result, some VCs are shifting how they work with blockchain startups. They will pre-acquire tokens prior to a public ICO, and even consult with startups to help them maximize the value of tokens and the underlying technology.
Going Institutional
The crypto asset class is also becoming more ubiquitous among institutional investors as well.
There’s such an institutional appetite to get exposure to this. It’s a half-a-trillion-dollar asset class that nobody owns. That’s a pretty wild circumstance.
– Dan Morehead, CEO and CIO of Pantera Capital
In fact, 17% of global hedge fund managers say they currently (or plan to) invest in cryptocurrency. At the same time, over 100 crypto hedge funds have popped up over the years – another sign of a widening and market landscape.


Technology
All of the Grants Given by the U.S. CHIPS Act
Intel, TSMC, and more have received billions in subsidies from the U.S. CHIPS Act in 2024.


All of the Grants Given by the U.S. CHIPS Act
This was originally posted on our Voronoi app. Download the app for free on iOS or Android and discover incredible data-driven charts from a variety of trusted sources.
This visualization shows which companies are receiving grants from the U.S. CHIPS Act, as of April 25, 2024. The CHIPS Act is a federal statute signed into law by President Joe Biden that authorizes $280 billion in new funding to boost domestic research and manufacturing of semiconductors.
The grant amounts visualized in this graphic are intended to accelerate the production of semiconductor fabrication plants (fabs) across the United States.
Data and Company Highlights
The figures we used to create this graphic were collected from a variety of public news sources. The Semiconductor Industry Association (SIA) also maintains a tracker for CHIPS Act recipients, though at the time of writing it does not have the latest details for Micron.
| Company | Federal Grant Amount | Anticipated Investment From Company |
|---|---|---|
| 🇺🇸 Intel | $8,500,000,000 | $100,000,000,000 |
| 🇹🇼 TSMC | $6,600,000,000 | $65,000,000,000 |
| 🇰🇷 Samsung | $6,400,000,000 | $45,000,000,000 |
| 🇺🇸 Micron | $6,100,000,000 | $50,000,000,000 |
| 🇺🇸 GlobalFoundries | $1,500,000,000 | $12,000,000,000 |
| 🇺🇸 Microchip | $162,000,000 | N/A |
| 🇬🇧 BAE Systems | $35,000,000 | N/A |
BAE Systems was not included in the graphic due to size limitations
Intel’s Massive Plans
Intel is receiving the largest share of the pie, with $8.5 billion in grants (plus an additional $11 billion in government loans). This grant accounts for 22% of the CHIPS Act’s total subsidies for chip production.
From Intel’s side, the company is expected to invest $100 billion to construct new fabs in Arizona and Ohio, while modernizing and/or expanding existing fabs in Oregon and New Mexico. Intel could also claim another $25 billion in credits through the U.S. Treasury Department’s Investment Tax Credit.
TSMC Expands its U.S. Presence
TSMC, the world’s largest semiconductor foundry company, is receiving a hefty $6.6 billion to construct a new chip plant with three fabs in Arizona. The Taiwanese chipmaker is expected to invest $65 billion into the project.
The plant’s first fab will be up and running in the first half of 2025, leveraging 4 nm (nanometer) technology. According to TrendForce, the other fabs will produce chips on more advanced 3 nm and 2 nm processes.
The Latest Grant Goes to Micron
Micron, the only U.S.-based manufacturer of memory chips, is set to receive $6.1 billion in grants to support its plans of investing $50 billion through 2030. This investment will be used to construct new fabs in Idaho and New York.

-

 Sports1 week ago
The Highest Earning Athletes in Seven Professional Sports
-

 Countries2 weeks ago
Population Projections: The World’s 6 Largest Countries in 2075
-

 Markets2 weeks ago
The Top 10 States by Real GDP Growth in 2023
-

 Demographics2 weeks ago
The Smallest Gender Wage Gaps in OECD Countries
-

 United States2 weeks ago
Where U.S. Inflation Hit the Hardest in March 2024
-

 Green2 weeks ago
Top Countries By Forest Growth Since 2001
-

 United States2 weeks ago
Ranked: The Largest U.S. Corporations by Number of Employees
-

 Maps2 weeks ago
The Largest Earthquakes in the New York Area (1970-2024)