Technology
This Giant Infographic Has 140+ Facts on the Scale of Amazon

This Giant Infographic Has 140+ Facts on the Scale of Amazon
As Amazon continues its takeover of the retail sector, the scale at which it operates continues to impress.
Back in late 2016 we examined the extraordinary size of Amazon from a market valuation perspective, which showed that the ecommerce giant was worth more than most brick and mortar retailers put together.
Today’s infographic from 16Best continues along that same thread, except this time focusing on Amazon from more of an operational perspective.
Amazon: At a Glance
Amazon has more than 304 million users, and 3 billion products selling on their 11 marketplaces – and every day, 1.3 million new products are added.
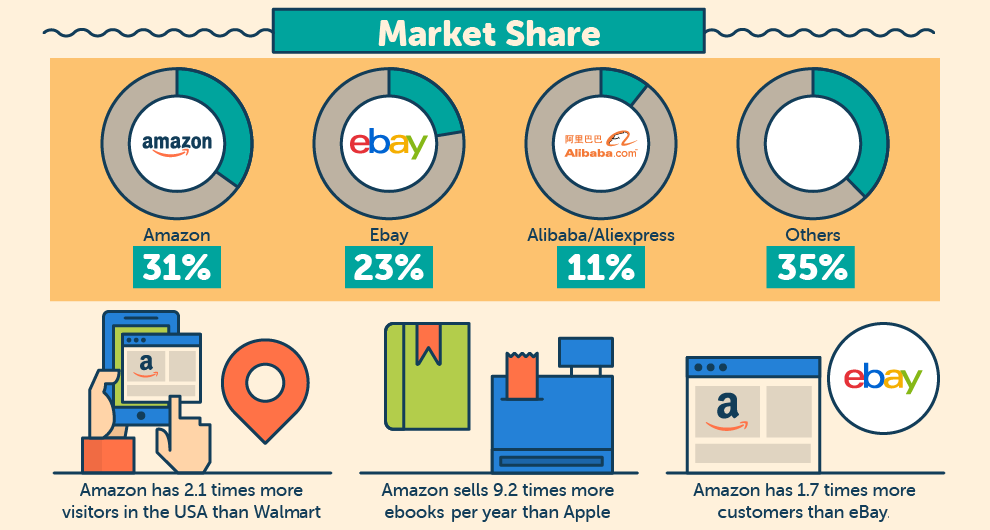
The company has a 43.5% market share of U.S. ecommerce spending. It’s no surprise then, that the average customer spends $700 per year with Amazon, and that 34.7 items are shipped every single second.
Shipping and Logistics
Amazon has 45,000 warehouse robots that work in the company’s 77 million square feet of warehouse space. This is equivalent to the size of 1,336 football fields.
The biggest single warehouse is in Schertz, TX, just outside of San Antonia, which alone measures 1,264,200 square feet. Warehouses this size can ship up to 1 million items per day during the holiday rush.
While Amazon spent $7.2 billion on shipping in 2016, it’s now looking to bring down the cost per unit shipped by using drone deliveries. The company anticipates to have 450,000 drones in its fleet by 2020.
Amazon Prime and Partners
A whopping 64% of U.S. households have Amazon Prime, which has proven to be a lucrative model for Amazon since those subscribers spend $1,300 per year on the site. Impressively, there are 40 million items eligible for Prime, and 8,000 cities where same-day shipping is a possibility.
Amazon Partners also play a big role in the ecosystem. There are 2 million sellers on Amazon, and 70,000 of them have sales of $100,000 or more per year using Amazon as a selling platform.
Why do sellers use Amazon? About 47% of sellers say it’s because it gives them access to new customers, while 65% say it’s to increase sales.
The top five categories for Amazon sellers: Clothing, Shoes & Jewelry, Electronics, Home & Kitchen, Sports & Outdoors, and Books.


Technology
Visualizing AI Patents by Country
See which countries have been granted the most AI patents each year, from 2012 to 2022.


Visualizing AI Patents by Country
This was originally posted on our Voronoi app. Download the app for free on iOS or Android and discover incredible data-driven charts from a variety of trusted sources.
This infographic shows the number of AI-related patents granted each year from 2010 to 2022 (latest data available). These figures come from the Center for Security and Emerging Technology (CSET), accessed via Stanford University’s 2024 AI Index Report.
From this data, we can see that China first overtook the U.S. in 2013. Since then, the country has seen enormous growth in the number of AI patents granted each year.
| Year | China | EU and UK | U.S. | RoW | Global Total |
|---|---|---|---|---|---|
| 2010 | 307 | 137 | 984 | 571 | 1,999 |
| 2011 | 516 | 129 | 980 | 581 | 2,206 |
| 2012 | 926 | 112 | 950 | 660 | 2,648 |
| 2013 | 1,035 | 91 | 970 | 627 | 2,723 |
| 2014 | 1,278 | 97 | 1,078 | 667 | 3,120 |
| 2015 | 1,721 | 110 | 1,135 | 539 | 3,505 |
| 2016 | 1,621 | 128 | 1,298 | 714 | 3,761 |
| 2017 | 2,428 | 144 | 1,489 | 1,075 | 5,136 |
| 2018 | 4,741 | 155 | 1,674 | 1,574 | 8,144 |
| 2019 | 9,530 | 322 | 3,211 | 2,720 | 15,783 |
| 2020 | 13,071 | 406 | 5,441 | 4,455 | 23,373 |
| 2021 | 21,907 | 623 | 8,219 | 7,519 | 38,268 |
| 2022 | 35,315 | 1,173 | 12,077 | 13,699 | 62,264 |
In 2022, China was granted more patents than every other country combined.
While this suggests that the country is very active in researching the field of artificial intelligence, it doesn’t necessarily mean that China is the farthest in terms of capability.
Key Facts About AI Patents
According to CSET, AI patents relate to mathematical relationships and algorithms, which are considered abstract ideas under patent law. They can also have different meaning, depending on where they are filed.
In the U.S., AI patenting is concentrated amongst large companies including IBM, Microsoft, and Google. On the other hand, AI patenting in China is more distributed across government organizations, universities, and tech firms (e.g. Tencent).
In terms of focus area, China’s patents are typically related to computer vision, a field of AI that enables computers and systems to interpret visual data and inputs. Meanwhile America’s efforts are more evenly distributed across research fields.
Learn More About AI From Visual Capitalist
If you want to see more data visualizations on artificial intelligence, check out this graphic that shows which job departments will be impacted by AI the most.

-

 Mining1 week ago
Gold vs. S&P 500: Which Has Grown More Over Five Years?
-

 Markets2 weeks ago
Ranked: The Most Valuable Housing Markets in America
-

 Money2 weeks ago
Which States Have the Highest Minimum Wage in America?
-

 AI2 weeks ago
Ranked: Semiconductor Companies by Industry Revenue Share
-

 Markets2 weeks ago
Ranked: The World’s Top Flight Routes, by Revenue
-

 Countries2 weeks ago
Population Projections: The World’s 6 Largest Countries in 2075
-

 Markets2 weeks ago
The Top 10 States by Real GDP Growth in 2023
-

 Demographics2 weeks ago
The Smallest Gender Wage Gaps in OECD Countries