Technology
The Extraordinary Size of Amazon in One Chart
The Extraordinary Size of Amazon in One Chart
It’s bigger than most brick and mortar retailers together
The Chart of the Week is a weekly Visual Capitalist feature on Fridays.
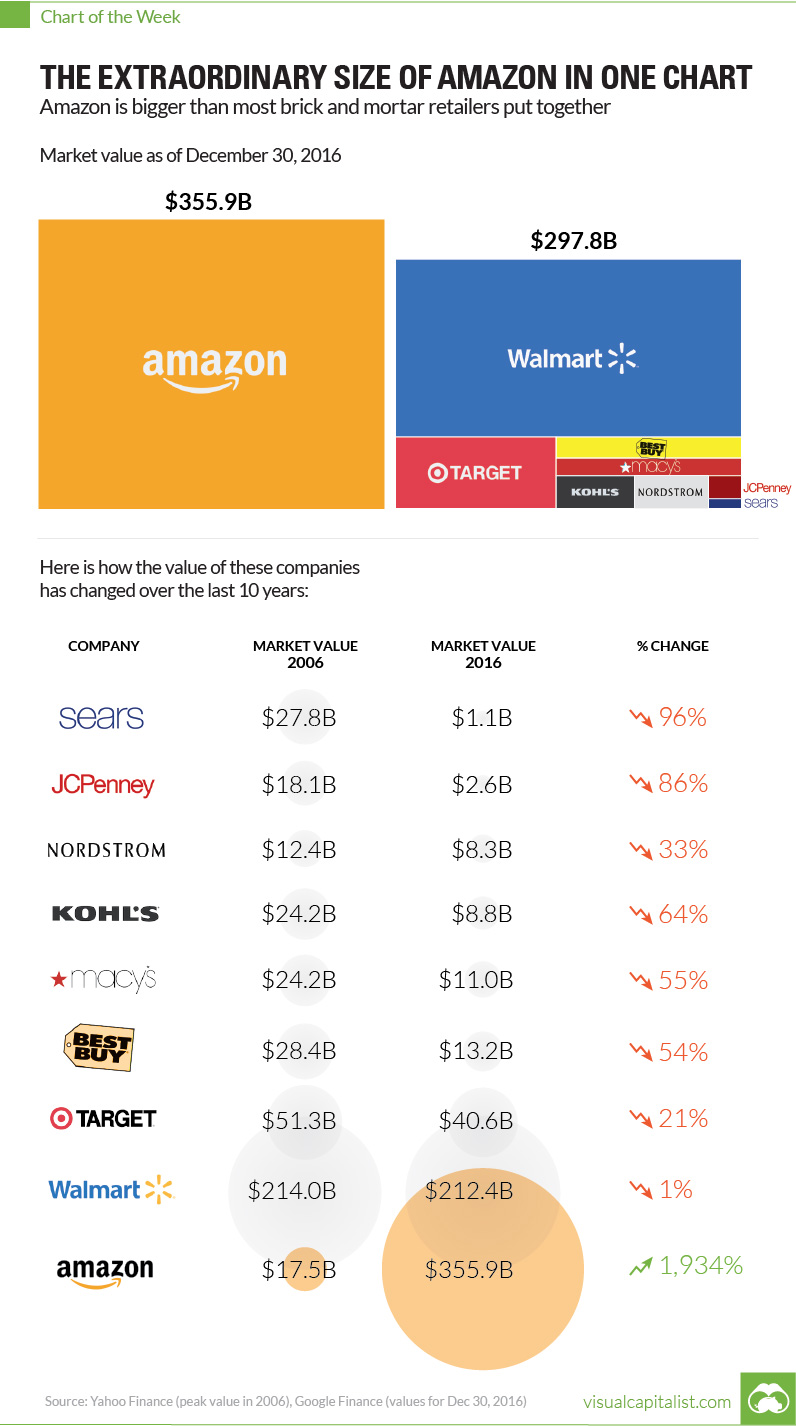
What has more value: all major publicly traded department stores in the United States, or Amazon?
Amazon takes the cake, and its no contest.
Add together the market caps of Walmart, Target, Best Buy, Nordstrom, Kohl’s, JCPenney, Sears, and Macy’s, and they amount to a significant $297.8 billion:
| Brick & Mortar Store | 2016 Value ($B) |
|---|---|
| Sears | $1.1 |
| JCPenney | $2.6 |
| Nordstrom | $8.3 |
| Kohl's | $8.8 |
| Macy's | $11.0 |
| Best Buy | $13.2 |
| Target | $40.6 |
| Walmart | $212.4 |
| Total | $297.8 |
However, it’s not enough to beat the Amazon machine.
The online retailer alone is worth $356 billion, making it one of the largest companies by market capitalization in the world.
The Death of Traditional Retail
Ten years ago, the future of brick and mortar retail sill looked bright. The aforementioned retailers were worth a collective $400 billion, and Amazon was only valued at $17.5 billion.
But disruption often comes without warning. Or if there were warning signs, they went unheeded by retailers.
Big box and department store sales plummeted, as consumers increasingly went online to do their shopping. This year, it is estimated that revenues are equal to just 62% of their totals in 2006:
Big Box and Department Store Sales ($ Billion)
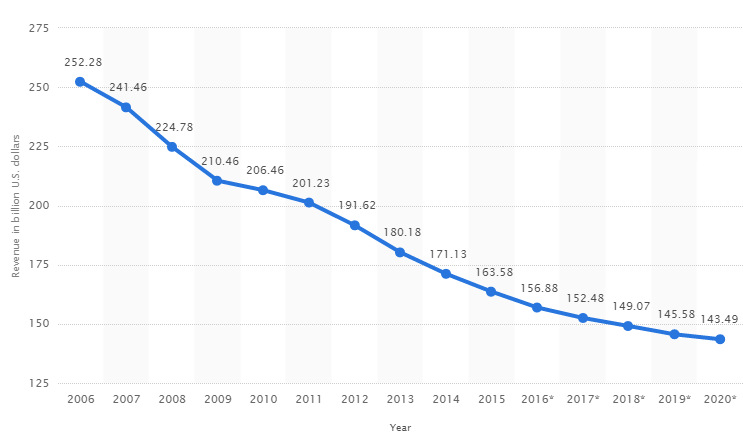
Retailers without the right strategy saw their market caps plummet.
Sears went from being worth $27.8 billion to $1.1 billion (a 96% decrease), while JCPenney went from $18.1 billion to $2.6 billion (a 86% decrease).
Here’s the full damage over the last 10 years to brick and mortar stores:
| Store | 2006 Value ($B) | 2016 Value ($B) | % Change |
|---|---|---|---|
| Sears | $27.8 | $1.1 | -96% |
| JCPenney | $18.1 | $2.6 | -86% |
| Nordstrom | $12.4 | $8.3 | -33% |
| Kohl's | $24.2 | $8.8 | -64% |
| Macy's | $24.2 | $11.0 | -55% |
| Best Buy | $28.4 | $13.2 | -54% |
| Target | $51.3 | $40.6 | -21% |
| Walmart | $214.0 | $212.4 | -1% |
| Total | $400.4 | $297.8 | -26% |
Amazon, on the other hand, did okay for itself.
The online retailer gained 1,934% in value over the same timeframe, making it one of the most valuable companies in the world, and a key piece of Jeff Bezos’ business empire.


Technology
All of the Grants Given by the U.S. CHIPS Act
Intel, TSMC, and more have received billions in subsidies from the U.S. CHIPS Act in 2024.


All of the Grants Given by the U.S. CHIPS Act
This was originally posted on our Voronoi app. Download the app for free on iOS or Android and discover incredible data-driven charts from a variety of trusted sources.
This visualization shows which companies are receiving grants from the U.S. CHIPS Act, as of April 25, 2024. The CHIPS Act is a federal statute signed into law by President Joe Biden that authorizes $280 billion in new funding to boost domestic research and manufacturing of semiconductors.
The grant amounts visualized in this graphic are intended to accelerate the production of semiconductor fabrication plants (fabs) across the United States.
Data and Company Highlights
The figures we used to create this graphic were collected from a variety of public news sources. The Semiconductor Industry Association (SIA) also maintains a tracker for CHIPS Act recipients, though at the time of writing it does not have the latest details for Micron.
| Company | Federal Grant Amount | Anticipated Investment From Company |
|---|---|---|
| 🇺🇸 Intel | $8,500,000,000 | $100,000,000,000 |
| 🇹🇼 TSMC | $6,600,000,000 | $65,000,000,000 |
| 🇰🇷 Samsung | $6,400,000,000 | $45,000,000,000 |
| 🇺🇸 Micron | $6,100,000,000 | $50,000,000,000 |
| 🇺🇸 GlobalFoundries | $1,500,000,000 | $12,000,000,000 |
| 🇺🇸 Microchip | $162,000,000 | N/A |
| 🇬🇧 BAE Systems | $35,000,000 | N/A |
BAE Systems was not included in the graphic due to size limitations
Intel’s Massive Plans
Intel is receiving the largest share of the pie, with $8.5 billion in grants (plus an additional $11 billion in government loans). This grant accounts for 22% of the CHIPS Act’s total subsidies for chip production.
From Intel’s side, the company is expected to invest $100 billion to construct new fabs in Arizona and Ohio, while modernizing and/or expanding existing fabs in Oregon and New Mexico. Intel could also claim another $25 billion in credits through the U.S. Treasury Department’s Investment Tax Credit.
TSMC Expands its U.S. Presence
TSMC, the world’s largest semiconductor foundry company, is receiving a hefty $6.6 billion to construct a new chip plant with three fabs in Arizona. The Taiwanese chipmaker is expected to invest $65 billion into the project.
The plant’s first fab will be up and running in the first half of 2025, leveraging 4 nm (nanometer) technology. According to TrendForce, the other fabs will produce chips on more advanced 3 nm and 2 nm processes.
The Latest Grant Goes to Micron
Micron, the only U.S.-based manufacturer of memory chips, is set to receive $6.1 billion in grants to support its plans of investing $50 billion through 2030. This investment will be used to construct new fabs in Idaho and New York.

-

 Science1 week ago
Visualizing the Average Lifespans of Mammals
-

 Markets2 weeks ago
The Top 10 States by Real GDP Growth in 2023
-

 Demographics2 weeks ago
The Smallest Gender Wage Gaps in OECD Countries
-

 United States2 weeks ago
Where U.S. Inflation Hit the Hardest in March 2024
-

 Green2 weeks ago
Top Countries By Forest Growth Since 2001
-

 United States2 weeks ago
Ranked: The Largest U.S. Corporations by Number of Employees
-

 Maps2 weeks ago
The Largest Earthquakes in the New York Area (1970-2024)
-

 Green2 weeks ago
Ranked: The Countries With the Most Air Pollution in 2023