Misc
The Iceberg That Sinks Organizational Culture Change
Most people are aware of the incredible power that company culture has in making or breaking a company.
While the concept of culture seems qualitative and fuzzy to many entrepreneurs or managers, the research on the impact of culture on organizations is very clear and data-driven. Companies with highly-engaged employees have low turnover, high productivity, more satisfied customers, and higher profits.
To sum it up culture’s potential impact more succinctly, management guru Peter Drucker famously put it a different way: “Culture eats strategy for breakfast.”
The Pitfalls of Culture Change
The benefits of a strong company culture are many – and it’s no surprise to see companies all over the world aspiring to build world-class cultures within their organizations at almost any cost.
The problem is that company culture, just like the culture that permeates through society, is based on hidden sets of assumptions, social norms, traditions, and unwritten rules that represent the way things actually get done in a company. As a result, decision makers often underestimate how challenging cultural change can be.
Today’s infographic comes from executive consultant Torben Rick, and it uses an iceberg analogy to show why organizational culture change sinks so many ships. At the top of the mass, there are visible indicators of a culture – but underneath is a bigger, invisible mass that holds all the ingrained cultural assumptions that are extremely difficult to affect.
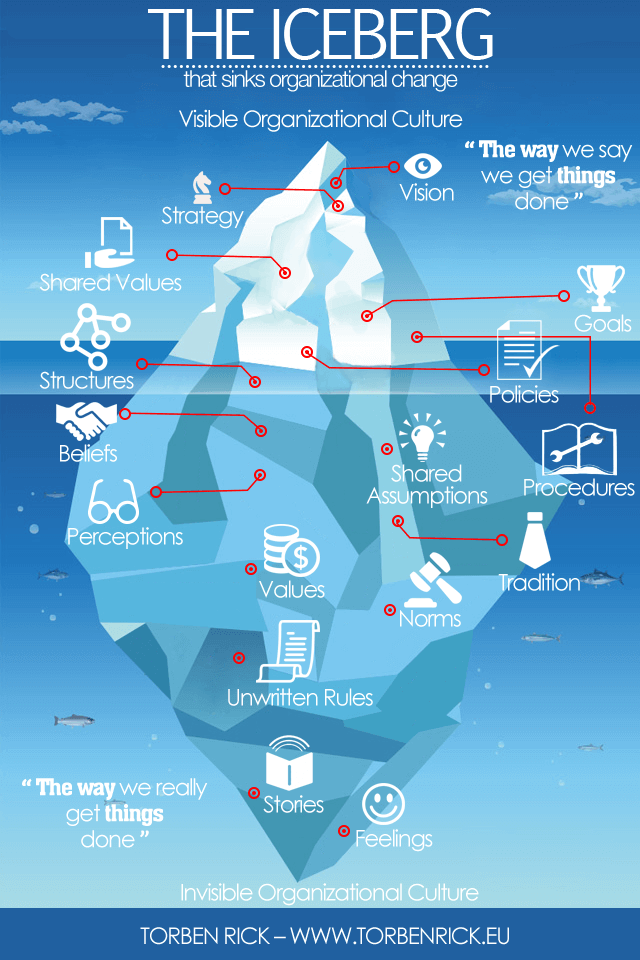
As Torben Rick puts it, the iceberg represents “the way we say we get things done” in contrast to the deeply-ingrained “way that things actually get done” within an organization.
In other words, for managers to positively affect cultural change, they not only need to address the top of the iceberg (vision, mission, values, etc.) but they must also make inroads on the bottom of the iceberg, which makes up more like 90% of a company’s actual culture.
Unfortunately, transforming these underlying perceptions, traditions, and shared assumptions is the real hard part of the exercise, and it can take many months or even years to see the results of such initiatives.
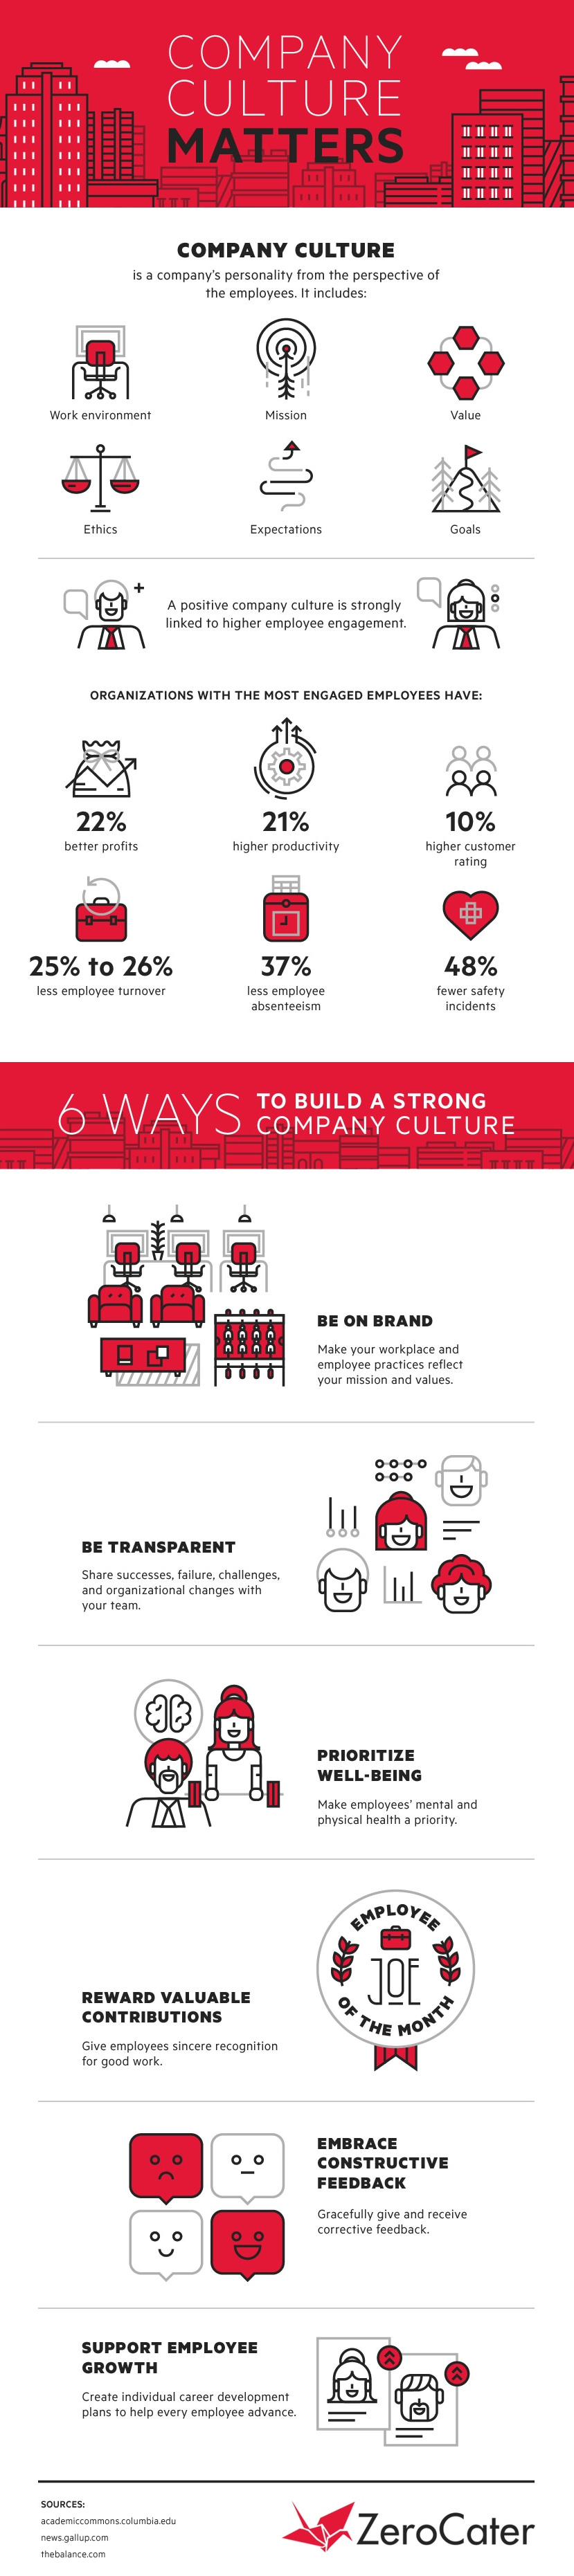
How to Build a Strong Company Culture
Cultural change cannot happen in one week of meetings, or through a few memos sent from higher ups. To effectively shape the bottom of the iceberg – those deeply-ingrained beliefs held throughout the organization – change must happen over a longer period of time where leading is done by example, and employees have the support they need to grow.
The following infographic from ZeroCater offers six ways to help get you started in building a strong culture.
As you embark on your voyage to build a stronger company culture, remember that organizational change is more complex and ingrained than it initially seems.
The amount of companies that are successful in these endeavors is far fewer than the amount that have tried – and this iceberg of organizational culture change has sunk many ships over time.


Misc
Visualizing the Most Common Pets in the U.S.
Lions, tigers, and bears, oh my!—these animals do not feature on this list of popular American household pets.


Visualizing The Most Common Pets in the U.S.
This was originally posted on our Voronoi app. Download the app for free on iOS or Android and discover incredible data-driven charts from a variety of trusted sources.
In this graphic, we visualized the most common American household pets, based on 2023-2024 data from the American Pet Products Association (accessed via Forbes Advisor).
Figures represent the number of households that own each pet type, rather than the actual number of each animal. The “small animal” category includes hamsters, gerbils, rabbits, guinea pigs, chinchillas, mice, rats, and ferrets.
What is the Most Popular American Household Pet?
Based on this data, dogs—one of the first domesticated animals—are the most common pets in the United States. In fact, around 65 million households own a dog, and spend an average of $900 a year on their care.
| Rank | Species | Households |
|---|---|---|
| 1 | 🐶 Dog | 65M |
| 2 | 🐱 Cat | 47M |
| 3 | 🐟 Freshwater Fish | 11M |
| 4 | 🐰 Small Animals | 7M |
| 5 | 🐦 Bird | 6M |
| 6 | 🦎 Reptile | 6M |
| 7 | 🐴 Horse | 2M |
| 8 | 🐠 Saltwater Fish | 2M |
Note: Households can own multiple pets, and are counted for all relevant categories.
Cats rank second, at 47 million households, and these smaller felines are a little less expensive to own at $700/year according to Forbes estimates.
But aside from these two juggernauts, there are plenty of other common pet types found in households across the country.
Freshwater fish can be found in 11 million households, along with small animals—rabbits, hamsters, guinea pigs—in 7 million. Meanwhile, nearly 6 million homes have birds or reptiles.
Pet Ownership is on the Rise in America
Forbes found that 66% of all American households (numbering 87 million) own at least one pet, up from 56% in 1988. One third of these (29 million) own multiple pets.
A combination of factors is driving this increase: rising incomes, delayed childbirth, and of course the impact of the pandemic which nearly cleared out animal shelters across the globe.
America’s loneliness epidemic may also be a factor. Fledgling research has shown that single-individual households with pets recorded lower rates of loneliness during the pandemic than those without a pet.

-

 Brands6 days ago
How Tech Logos Have Evolved Over Time
-

 Demographics2 weeks ago
The Smallest Gender Wage Gaps in OECD Countries
-

 Economy2 weeks ago
Where U.S. Inflation Hit the Hardest in March 2024
-

 Green2 weeks ago
Top Countries By Forest Growth Since 2001
-

 United States2 weeks ago
Ranked: The Largest U.S. Corporations by Number of Employees
-

 Maps2 weeks ago
The Largest Earthquakes in the New York Area (1970-2024)
-

 Green2 weeks ago
Ranked: The Countries With the Most Air Pollution in 2023
-

 Green2 weeks ago
Ranking the Top 15 Countries by Carbon Tax Revenue