Sponsored
Everything You Need to Know on Carlin-Type Gold Deposits
The following content is sponsored by Nevada Exploration
Carlin-Type Gold Deposits: Everything You Need to Know
Nevada is one of the world’s most productive gold-mining regions, and it’s the high-grade Carlin-type gold deposits (CTGDs) that put the Silver State on the gold mining map.
Carlin-type gold deposits contain “invisible” or microscopic particles of gold that are deposited within a mineral called pyrite in sedimentary rocks. Needless to say, these deposits are named after the discovery of the Carlin Gold Deposit in 1961, which was the first of its kind.
Today, Carlin-type deposits make up the bulk of Nevada’s gold production. This infographic from our sponsor Nevada Exploration details everything you need to know about CTGDs.
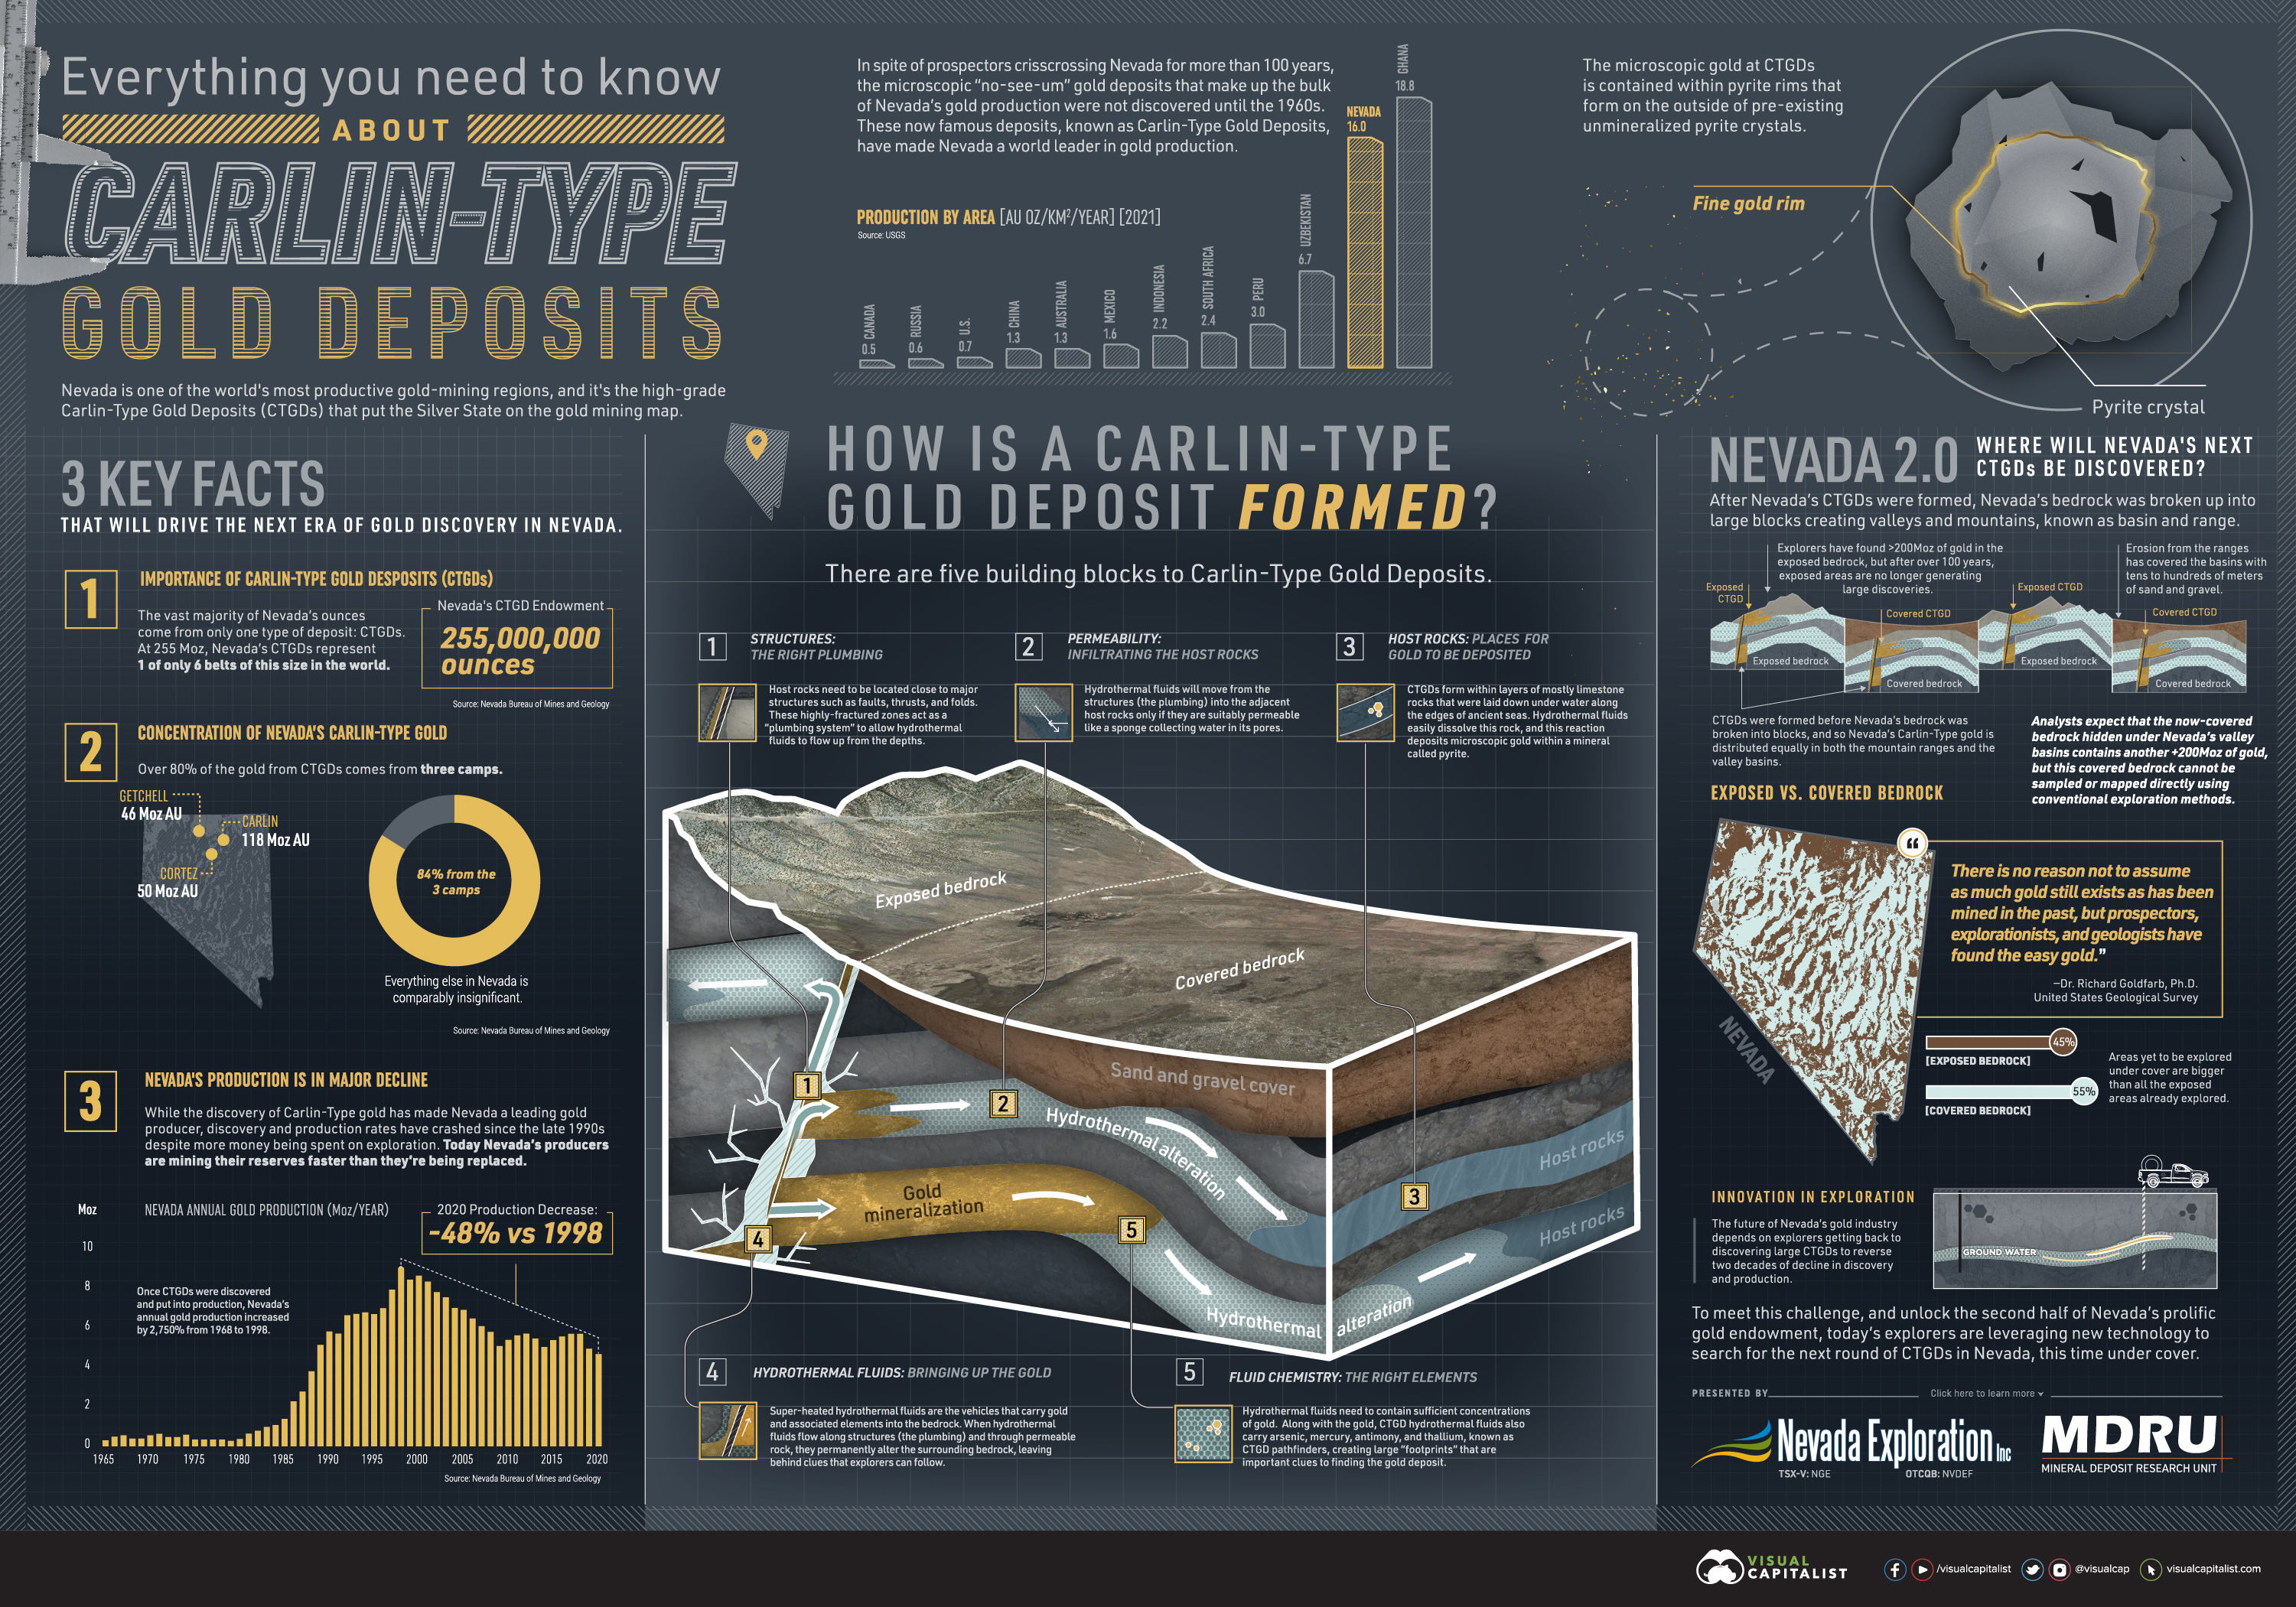
The Building Blocks of Carlin-Type Gold Deposits
Nevada’s CTGDs contain 255 million ounces of gold, representing one of only six gold belts of this size in the world. Furthermore, 84% or 214 million ounces of Nevada’s CTGD gold is concentrated in just three camps:
- Carlin camp: 118 million ounces
- Cortez camp: 50 million ounces
- Getchell camp: 46 million ounces
So, just how are these massive deposits of invisible gold formed?
Building Block #1:
Structures
The rocks that host CTGDs are typically found close to major geological structures in the Earth’s crust. These structures include:
- Faults: A fracture or a zone of fracture between two rocks.
- Thrust faults: A fault across which older rocks are pushed above younger rocks.
- Folds: A wave-like structure that forms when rocks deform by bending.
These fractured zones act as a ‘plumbing system’ to allow mineral-rich hydrothermal fluids to flow up from the depths of the Earth’s crust.
Building Block #2:
Permeability
The host rocks of CTGDs need to be permeable enough for hydrothermal fluids to flow from the fractured structures (the plumbing) into the host rocks, where minerals will be eventually deposited.
Building Block #3:
Host Rocks
Host rocks are places for the gold to be deposited. CTGDs typically form within layers of limestone rocks that were laid down millions of years ago. When hot hydrothermal fluids hit these rocks, they dissolve easily, and this reaction deposits microscopic gold within the mineral called pyrite we mentioned earlier.
Building Block #4:
Hydrothermal Fluids
Hydrothermal fluids are super-heated water solutions that flow up from deep within the Earth’s crust. These are the vehicles that carry gold and other elements into the host rock, often leaving geological clues behind for explorers to follow.
Building Block #5:
Fluid Chemistry
Along with gold, CTGD hydrothermal fluids carry arsenic, mercury, antimony, and thallium, known as ‘CTGD pathfinders’. These create ‘footprints’ that are important clues to finding the gold. Additionally, hydrothermal fluids need to contain sufficient concentrations of gold for the deposit to be economically viable.
The discovery of CTGDs has made Nevada a leading gold producer globally. However, discovery and production rates have crashed since the late 1990s, despite more money being spent on exploration.
But if explorers look in the right places, there could be plenty of Carlin-type gold left to find.
Seeing Through the Cover: Nevada’s Next CTGDs
After the formation of CTGDs millions of years ago, Nevada’s bedrock was broken up into large blocks creating valleys and mountains, known as basin and range respectively.
Therefore, Nevada’s Carlin-type gold was distributed equally in both the mountain ranges and the valley basins. The deposits in the mountain ranges lay in exposed bedrock, making them easier to find. However, erosion from the ranges covered the valley basins with tens to hundreds of meters of sand and gravel.
The unexplored under cover bedrock area is bigger than the exposed areas already explored, and analysts expect that it contains over 200 million ounces of gold. But finding under cover gold will not be easy using conventional exploration methods. To meet this challenge and unlock the second half of Nevada’s gold endowment, explorers are leveraging new technology to search for hidden CTGDs.
Nevada Exploration is an early leader in applying new technology to uncover the second half of Carlin-type gold in Nevada.
Sponsored
Ranked: Emissions per Capita of the Top 30 U.S. Investor-Owned Utilities
Roughly 25% of all GHG emissions come from electricity production. See how the top 30 IOUs rank by emissions per capita.

Emissions per Capita of the Top 30 U.S. Investor-Owned Utilities
Approximately 25% of all U.S. greenhouse gas emissions (GHG) come from electricity generation.
Subsequently, this means investor-owned utilities (IOUs) will have a crucial role to play around carbon reduction initiatives. This is particularly true for the top 30 IOUs, where almost 75% of utility customers get their electricity from.
This infographic from the National Public Utilities Council ranks the largest IOUs by emissions per capita. By accounting for the varying customer bases they serve, we get a more accurate look at their green energy practices. Here’s how they line up.
Per Capita Rankings
The emissions per capita rankings for the top 30 investor-owned utilities have large disparities from one another.
Totals range from a high of 25.8 tons of CO2 per customer annually to a low of 0.5 tons.
Utility | Emissions Per Capita (CO2 tons per year) | Total Emissions (M) |
---|---|---|
TransAlta | 25.8 | 16.3 |
Vistra | 22.4 | 97.0 |
OGE Energy | 21.5 | 18.2 |
AES Corporation | 19.8 | 49.9 |
Southern Company | 18.0 | 77.8 |
Evergy | 14.6 | 23.6 |
Alliant Energy | 14.4 | 14.1 |
DTE Energy | 14.2 | 29.0 |
Berkshire Hathaway Energy | 14.0 | 57.2 |
Entergy | 13.8 | 40.5 |
WEC Energy | 13.5 | 22.2 |
Ameren | 12.8 | 31.6 |
Duke Energy | 12.0 | 96.6 |
Xcel Energy | 11.9 | 43.3 |
Dominion Energy | 11.0 | 37.8 |
Emera | 11.0 | 16.6 |
PNM Resources | 10.5 | 5.6 |
PPL Corporation | 10.4 | 28.7 |
American Electric Power | 9.2 | 50.9 |
Consumers Energy | 8.7 | 16.1 |
NRG Energy | 8.2 | 29.8 |
Florida Power and Light | 8.0 | 41.0 |
Portland General Electric | 7.6 | 6.9 |
Fortis Inc. | 6.1 | 12.6 |
Avangrid | 5.1 | 11.6 |
PSEG | 3.9 | 9.0 |
Exelon | 3.8 | 34.0 |
Consolidated Edison | 1.6 | 6.3 |
Pacific Gas and Electric | 0.5 | 2.6 |
Next Era Energy Resources | 0 | 1.1 |
PNM Resources data is from 2019, all other data is as of 2020
Let’s start by looking at the higher scoring IOUs.
TransAlta
TransAlta emits 25.8 tons of CO2 emissions per customer, the largest of any utility on a per capita basis. Altogether, the company’s 630,000 customers emit 16.3 million metric tons. On a recent earnings call, its management discussed clear intent to phase out coal and grow their renewables mix by doubling their renewables fleet. And so far it appears they’ve been making good on their promise, having shut down the Canadian Highvale coal mine recently.
Vistra
Vistra had the highest total emissions at 97 million tons of CO2 per year and is almost exclusively a coal and gas generator. However, the company announced plans for 60% reductions in CO2 emissions by 2030 and is striving to be carbon neutral by 2050. As the highest total emitter, this transition would make a noticeable impact on total utility emissions if successful.
Currently, based on their 4.3 million customers, Vistra sees per capita emissions of 22.4 tons a year. The utility is a key electricity provider for Texas, ad here’s how their electricity mix compares to that of the state as a whole:
Energy Source | Vistra | State of Texas |
---|---|---|
Gas | 63% | 52% |
Coal | 29% | 15% |
Nuclear | 6% | 9% |
Renewables | 1% | 24% |
Oil | 1% | 0% |
Despite their ambitious green energy pledges, for now only 1% of Vistra’s electricity comes from renewables compared to 24% for Texas, where wind energy is prospering.
Based on those scores, the average customer from some of the highest emitting utility groups emit about the same as a customer from each of the bottom seven, who clearly have greener energy practices. Let’s take a closer look at emissions for some of the bottom scoring entities.
Utilities With The Greenest Energy Practices
Groups with the lowest carbon emission scores are in many ways leaders on the path towards a greener future.
Exelon
Exelon emits only 3.8 tons of CO2 emissions per capita annually and is one of the top clean power generators across the Americas. In the last decade they’ve reduced their GHG emissions by 18 million metric tons, and have recently teamed up with the state of Illinois through the Clean Energy Jobs Act. Through this, Exelon will receive $700 million in subsidies as it phases out coal and gas plants to meet 2030 and 2045 targets.
Consolidated Edison
Consolidated Edison serves nearly 4 million customers with a large chunk coming from New York state. Altogether, they emit 1.6 tons of CO2 emissions per capita from their electricity generation.
The utility group is making notable strides towards a sustainable future by expanding its renewable projects and testing higher capacity limits. In addition, they are often praised for their financial management and carry the title of dividend aristocrat, having increased their dividend for 47 years and counting. In fact, this is the longest out of any utility company in the S&P 500.
A Sustainable Tomorrow
Altogether, utilities will have a pivotal role to play in decarbonization efforts. This is particularly true for the top 30 U.S. IOUs, who collectively serve 60 million Americans, or one-fifth of the U.S. population.
Ultimately, this means a unique moment for utilities is emerging. As the transition toward cleaner energy continues and various groups push to achieve their goals, all eyes will be on utilities to deliver.
The National Public Utilities Council is the go-to resource to learn how utilities can lead in the path towards decarbonization.
Sponsored
The Road to Decarbonization: How Asphalt is Affecting the Planet
The U.S. alone generates ∼12 million tons of asphalt shingles tear-off waste and installation scrap every year and more than 90% of it is dumped into landfills.

The Road to Decarbonization: How Asphalt is Affecting the Planet
Asphalt, also known as bitumen, has various applications in the modern economy, with annual demand reaching 110 million tons globally.
Until the 20th century, natural asphalt made from decomposed plants accounted for the majority of asphalt production. Today, most asphalt is refined from crude oil.
This graphic, sponsored by Northstar Clean Technologies, shows how new technologies to reuse and recycle asphalt can help protect the environment.
The Impact of Climate Change
Pollution from vehicles is expected to decline as electric vehicles replace internal combustion engines.
But pollution from asphalt could actually increase in the next decades because of rising temperatures in some parts of the Earth. When subjected to extreme temperatures, asphalt releases harmful greenhouse gases (GHG) into the atmosphere.
Emissions from Road Construction (Source) | CO2 equivalent (%) |
---|---|
Asphalt | 28% |
Concrete | 18% |
Excavators and Haulers | 16% |
Trucks | 13% |
Crushing Plant | 10% |
Galvanized Steel | 6% |
Reinforced Steel | 6% |
Plastic Piping | 2% |
Geotextile | 1% |
Asphalt paved surfaces and roofs make up approximately 45% and 20% of surfaces in U.S. cities, respectively. Furthermore, 75% of single-family detached homes in Canada and the U.S. have asphalt shingles on their roofs.
Reducing the Environmental Impact of Asphalt
Similar to roads, asphalt shingles have oil as the primary component, which is especially harmful to the environment.
Shingles do not decompose or biodegrade. The U.S. alone generates ∼12 million tons of asphalt shingles tear-off waste and installation scrap every year and more than 90% of it is dumped into landfills, the equivalent of 20 million barrels of oil.
But most of it can be reused, rather than taking up valuable landfill space.
Using technology, the primary components in shingles can be repurposed into liquid asphalt, aggregate, and fiber, for use in road construction, embankments, and new shingles.
Providing the construction industry with clean, sustainable processing solutions is also a big business opportunity. Canada alone is a $1.3 billion market for recovering and reprocessing shingles.
Northstar Clean Technologies is the only public company that repurposes 99% of asphalt shingles components that otherwise go to landfills.
-
Misc5 days ago
The Top 10 Largest Nuclear Explosions, Visualized
-
Technology3 weeks ago
How Do Big Tech Giants Make Their Billions?
-
Green4 weeks ago
Visualizing All Electric Car Models Available in the U.S.
-
Markets4 weeks ago
Satellite Maps: Shanghai’s Supply Chain Standstill
-
Energy1 week ago
Mapped: Solar and Wind Power by Country
-
Datastream3 weeks ago
Visualizing Companies with the Most Patents Granted in 2021
-
Technology1 week ago
Synthetic Biology: The $3.6 Trillion Science Changing Life as We Know It
-
Markets3 weeks ago
Why Investors Tuned Out Netflix