Misc
Which Values Children Should Be Encouraged to Learn, By Country
Many of the values we prioritize as adults were instilled in us during our childhood days.
They’re called our formative years for a reason—from when we’re born up until we’re about eight years old, our brains are easily molded and remain highly sensitive to external influences and environments. But depending on where you grew up, you may have been exposed to different values during your childhood compared to someone from another place.
These visualizations by Anders Sundell illustrate the most important values people think children should learn at home, across more than 80 different countries.
Methodology
Sundell used data from the World Values Survey, an international survey that interviews hundreds of thousands of participants from across the globe. Respondents were asked to pick up to five qualities they believe are the most desirable for children to have:
- Good manners
- Independence
- Hard work
- Feeling of responsibility
- Imagination
- Tolerance and respect for other people
- Thrift, saving money
- Determination and perseverance
- Religious faith
- Unselfishness
- Obedience
Sundell took the survey data and calculated the proportion of people in each country that selected each quality. From there, he took the top qualities and created three separate plot graphs to show the contrast between them.
Let’s look at the importance that countries placed on different values, including (1) independence and obedience, (2) unselfishness and religious faith, and (3) hard work and imagination.
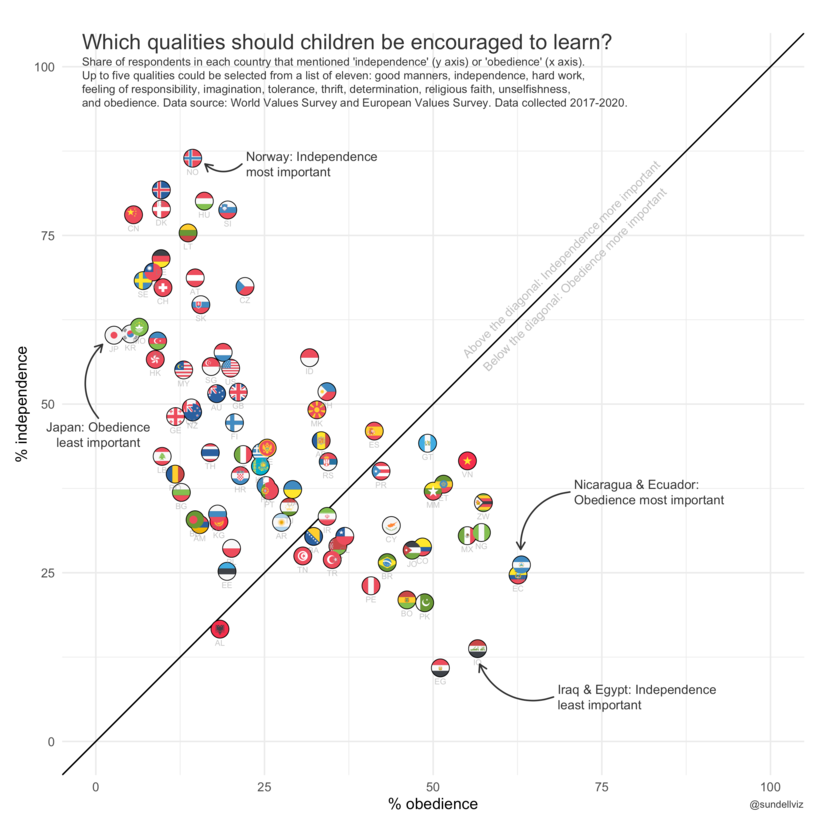
1. Independence vs Obedience
Nordic countries value independence greatly, and find obedience to be a less important quality to instill in children.
View the full-size infographic
Other available data also supports that adults in Nordic countries value independence. According to Eurostat, the most common age to leave home in Sweden is between 17 and 18—nearly a decade sooner than the average age across the EU (26 years old).
Denmark’s average age to leave home is also below the European average, at 21 years old.
On the other end of the spectrum, countries like Iraq and Egypt believe obedience is much more important for children to learn.
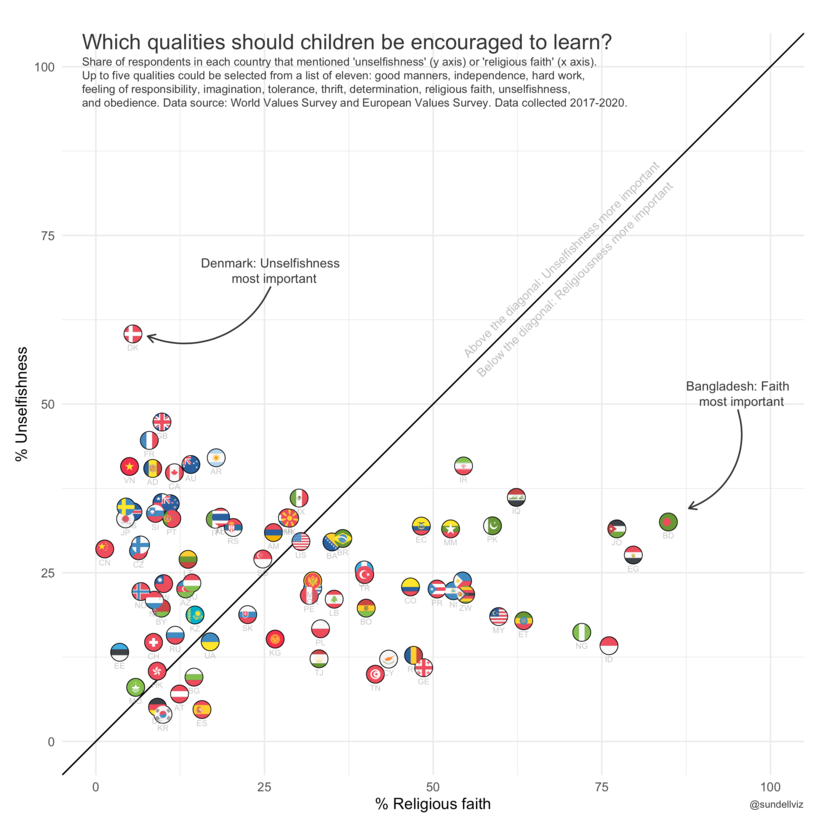
2. Unselfishness vs Religious Faith
Bangladesh, Egypt, and Jordan all place a strong emphasis on faith, and fall on the far right of this graph.
View the full-size infographic
Islam is a strong influence in all three of these countries. In Bangladesh and Jordan, it’s the official state religion. And while Egypt is a secular country, a majority of citizens identify as Muslim—about 90% of the population.
Interestingly, places like the U.S. and Hong Kong fall right in the between, placing relatively equal importance on religion and unselfishness.
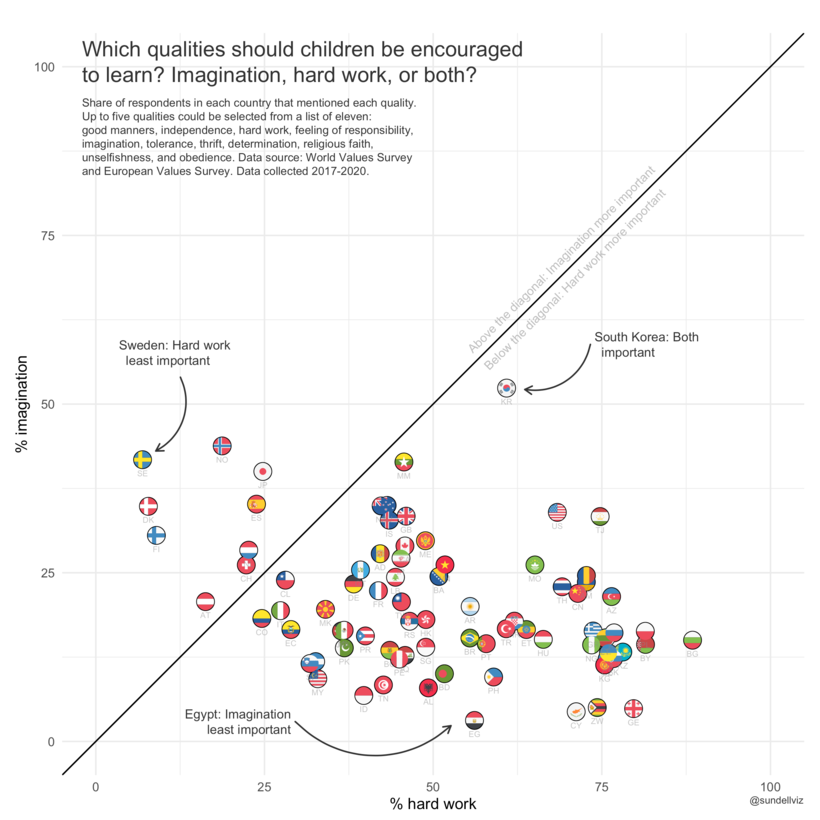
3. Hard Work vs Imagination
Left-leaning Nordic countries like Sweden, Norway, Denmark, and Finland think imagination is more important for children to learn than hard work.
View the full-size infographic
Interestingly, Japan also scored high for imagination, seeing it was a more important value to teach children than hard work. This is despite the fact that the country has an international reputation for being a hardworking country, where even taking an extended vacation can be frowned upon. Then again, Japan has a reputation for producing wildly creative works of art that are popular internationally (anime, for instance).
As expected, countries and cultures contain multitudes, and can often seem paradoxical and complex to those who try to codify them.
What qualities do you think are most important, and what countries surprised you with their placements?

This article was published as a part of Visual Capitalist's Creator Program, which features data-driven visuals from some of our favorite Creators around the world.
VC+
VC+: Get Our Key Takeaways From the IMF’s World Economic Outlook
A sneak preview of the exclusive VC+ Special Dispatch—your shortcut to understanding IMF’s World Economic Outlook report.

Have you read IMF’s latest World Economic Outlook yet? At a daunting 202 pages, we don’t blame you if it’s still on your to-do list.
But don’t worry, you don’t need to read the whole April release, because we’ve already done the hard work for you.
To save you time and effort, the Visual Capitalist team has compiled a visual analysis of everything you need to know from the report—and our VC+ Special Dispatch is available exclusively to VC+ members. All you need to do is log into the VC+ Archive.
If you’re not already subscribed to VC+, make sure you sign up now to access the full analysis of the IMF report, and more (we release similar deep dives every week).
For now, here’s what VC+ members get to see.
Your Shortcut to Understanding IMF’s World Economic Outlook
With long and short-term growth prospects declining for many countries around the world, this Special Dispatch offers a visual analysis of the key figures and takeaways from the IMF’s report including:
- The global decline in economic growth forecasts
- Real GDP growth and inflation forecasts for major nations in 2024
- When interest rate cuts will happen and interest rate forecasts
- How debt-to-GDP ratios have changed since 2000
- And much more!
Get the Full Breakdown in the Next VC+ Special Dispatch
VC+ members can access the full Special Dispatch by logging into the VC+ Archive, where you can also check out previous releases.
Make sure you join VC+ now to see exclusive charts and the full analysis of key takeaways from IMF’s World Economic Outlook.
Don’t miss out. Become a VC+ member today.
What You Get When You Become a VC+ Member
VC+ is Visual Capitalist’s premium subscription. As a member, you’ll get the following:
- Special Dispatches: Deep dive visual briefings on crucial reports and global trends
- Markets This Month: A snappy summary of the state of the markets and what to look out for
- The Trendline: Weekly curation of the best visualizations from across the globe
- Global Forecast Series: Our flagship annual report that covers everything you need to know related to the economy, markets, geopolitics, and the latest tech trends
- VC+ Archive: Hundreds of previously released VC+ briefings and reports that you’ve been missing out on, all in one dedicated hub
You can get all of the above, and more, by joining VC+ today.
-

 Energy1 week ago
The World’s Biggest Nuclear Energy Producers
-

 Money2 weeks ago
Which States Have the Highest Minimum Wage in America?
-

 Technology2 weeks ago
Ranked: Semiconductor Companies by Industry Revenue Share
-

 Markets2 weeks ago
Ranked: The World’s Top Flight Routes, by Revenue
-

 Countries2 weeks ago
Population Projections: The World’s 6 Largest Countries in 2075
-

 Markets2 weeks ago
The Top 10 States by Real GDP Growth in 2023
-

 Demographics2 weeks ago
The Smallest Gender Wage Gaps in OECD Countries
-

 United States2 weeks ago
Where U.S. Inflation Hit the Hardest in March 2024
