Misc
Visualizing 40 Different Animal Sleep Patterns
Article/Editing:
Click to view a larger version of the graphic.
Visualizing 40 Different Animal Sleep Patterns
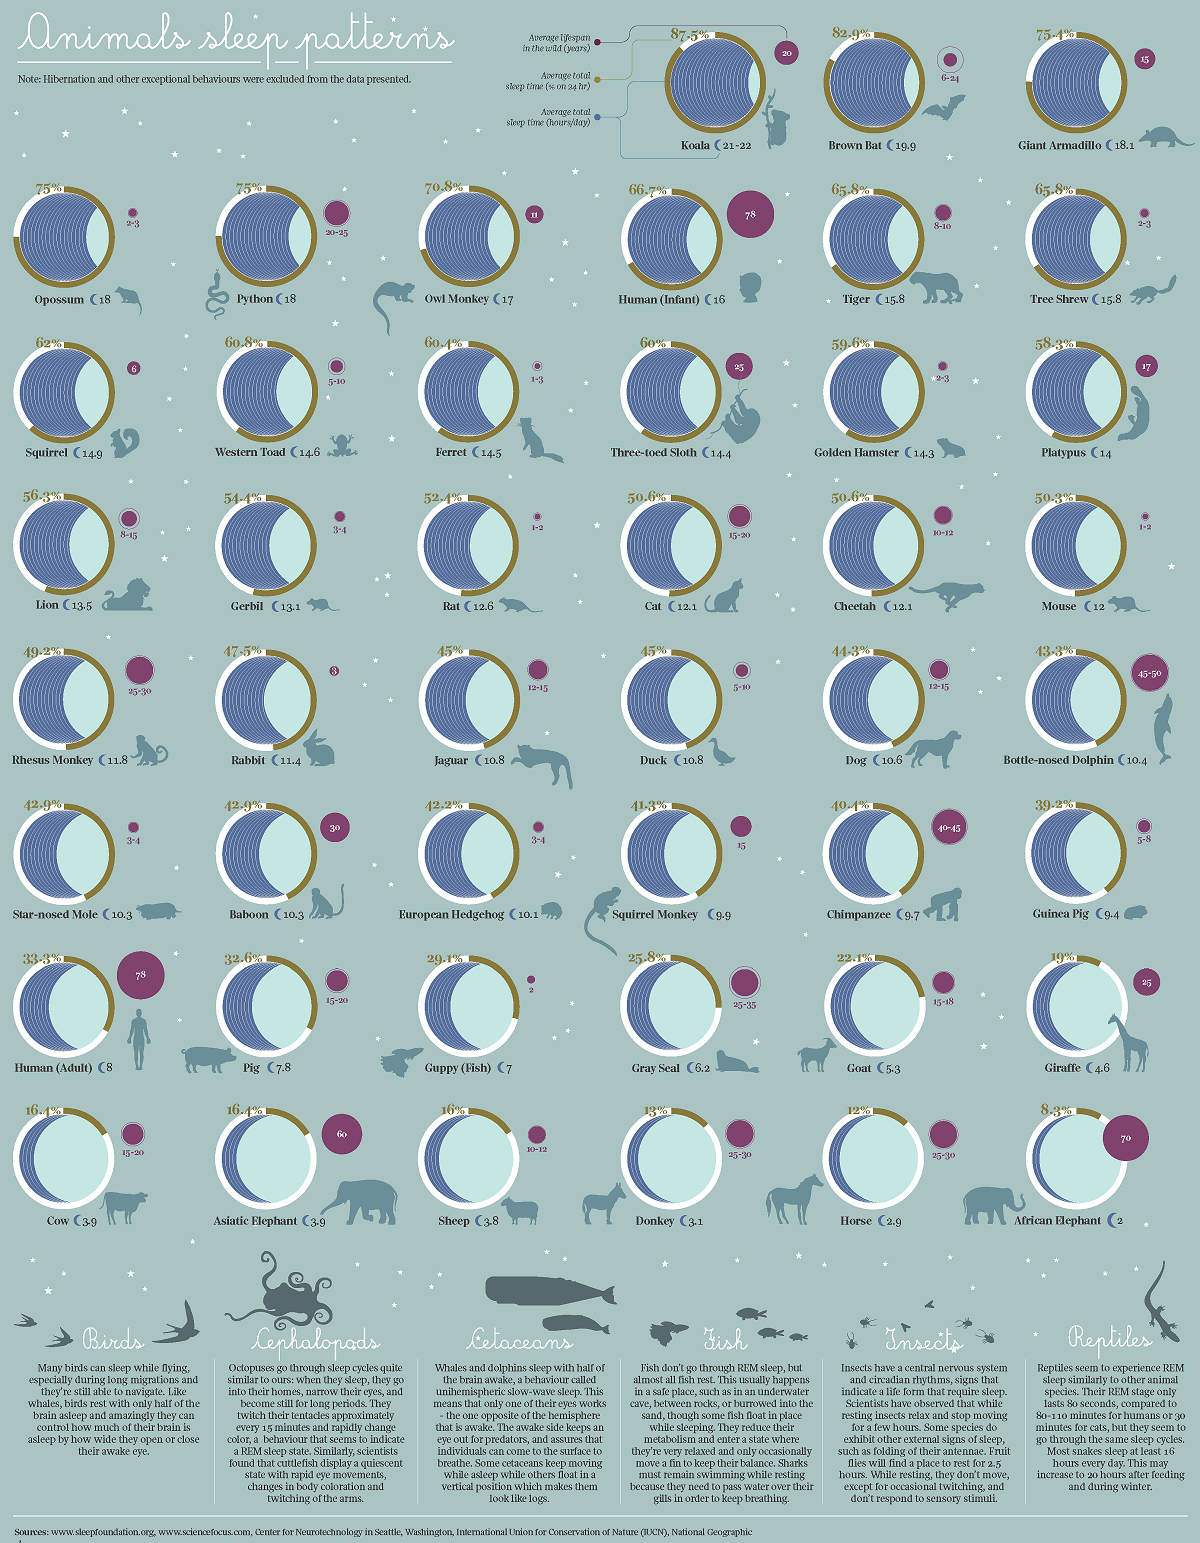
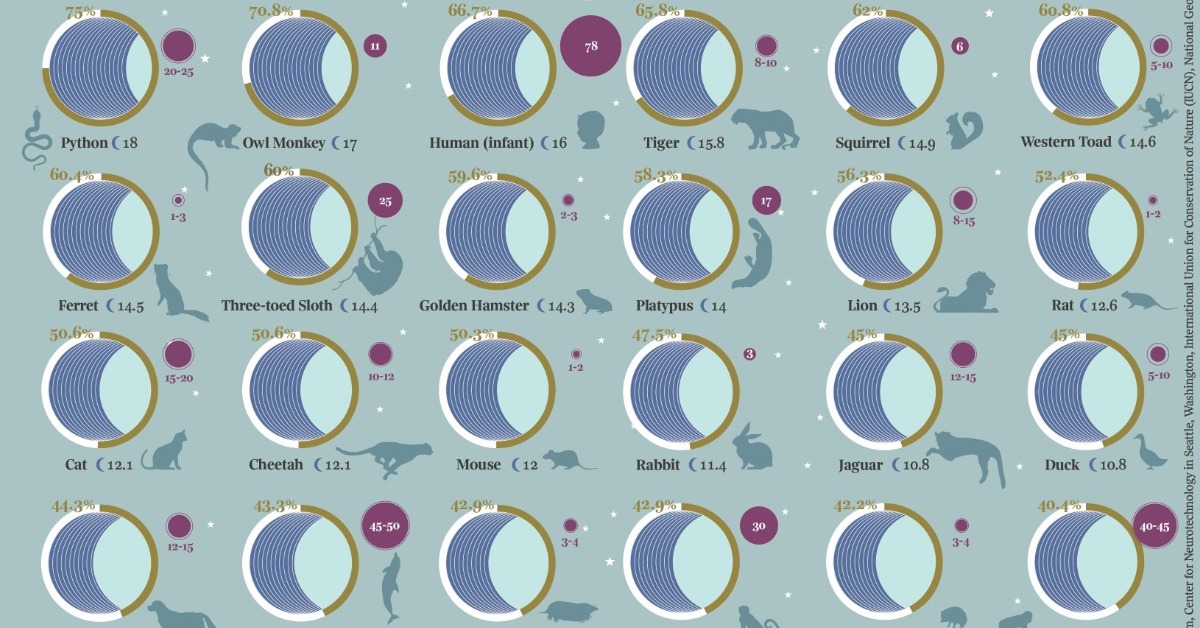
Every animal has to rest in some way, but some animals need a lot more sleep than others.
This graphic by Giulia De Amicis uses data from startsleeping.com to show the typical sleeping patterns of 40 different animals, highlighting their average sleep times, and what percentage of each 24-hour day they spend resting.
Compared to the rest of the animals featured in the graphic, humans need a relatively small amount of sleep. We sleep for an average of eight hours—or 33% of our day.
| Animal | Average Sleep Time (hrs/day) | Average Sleep Time (% of 24 hours) |
|---|---|---|
| Koala | 21-22 | 87.5% |
| Brown Bat | 19.9 | 82.9% |
| Giant Armadillo | 18.1 | 75.4% |
| Opossum | 18.0 | 75.0% |
| Python | 18.0 | 75.0% |
| Owl Monkey | 17.0 | 70.8% |
| Human (Infant) | 16.0 | 66.7% |
| Tiger | 15.8 | 65.8% |
| Tree Shrew | 15.8 | 65.8% |
| Squirrel | 14.9 | 62.0% |
| Western Toad | 14.6 | 60.8% |
| Ferret | 14.5 | 60.4% |
| Three-toed Sloth | 14.4 | 60.0% |
| Golden Hamster | 14.3 | 59.6% |
| Platypus | 14.0 | 58.3% |
| Lion | 13.5 | 56.3% |
| Gerbil | 13.1 | 54.4% |
| Rat | 12.6 | 52.4% |
| Cat | 12.1 | 50.6% |
| Cheetah | 12.1 | 50.6% |
| Mouse | 12.0 | 50.3% |
| Rhesus Monkey | 11.8 | 49.2% |
| Rabbit | 11.4 | 47.5% |
| Jaguar | 10.8 | 45.0% |
| Duck | 10.8 | 45.0% |
| Dog | 10.6 | 44.3% |
| Bottle-nose Dolphin | 10.4 | 43.3% |
| Star-nosed Mole | 10.3 | 42.9% |
| Baboon | 10.3 | 42.9% |
| European Hedgehog | 10.1 | 42.2% |
| Squirrel Monkey | 9.9 | 41.3% |
| Chimpanzee | 9.7 | 40.4% |
| Guinea Pig | 9.4 | 39.2% |
| Human (Adult) | 8.0 | 33.3% |
| Pig | 7.8 | 32.6% |
| Guppy (Fish) | 7.0 | 29.1% |
| Gray Seal | 6.2 | 25.8% |
| Goat | 5.3 | 22.1% |
| Giraffe | 4.6 | 19.0% |
| Cow | 3.9 | 16.4% |
| Asiatic Elephant | 3.9 | 16.4% |
| Sheep | 3.8 | 16.0% |
| Donkey | 3.1 | 13.0% |
| Horse | 2.9 | 12.0% |
| African Elephant | 2.0 | 8.3% |
In contrast, Koalas sleep up to 22 hours a day, or 87.5% of the day. This is mostly because of the Koala’s diet—Koalas eat Eucalyptus leaves, which are toxic and take a lot of energy to digest.

This article was published as a part of Visual Capitalist's Creator Program, which features data-driven visuals from some of our favorite Creators around the world.


United States
Visualizing the Most Common Pets in the U.S.
Lions, tigers, and bears, oh my!—these animals do not feature on this list of popular American household pets.


Visualizing The Most Common Pets in the U.S.
This was originally posted on our Voronoi app. Download the app for free on iOS or Android and discover incredible data-driven charts from a variety of trusted sources.
In this graphic, we visualized the most common American household pets, based on 2023-2024 data from the American Pet Products Association (accessed via Forbes Advisor).
Figures represent the number of households that own each pet type, rather than the actual number of each animal. The “small animal” category includes hamsters, gerbils, rabbits, guinea pigs, chinchillas, mice, rats, and ferrets.
What is the Most Popular American Household Pet?
Based on this data, dogs—one of the first domesticated animals—are the most common pets in the United States. In fact, around 65 million households own a dog, and spend an average of $900 a year on their care.
| Rank | Species | Households |
|---|---|---|
| 1 | 🐶 Dog | 65M |
| 2 | 🐱 Cat | 47M |
| 3 | 🐟 Freshwater Fish | 11M |
| 4 | 🐰 Small Animals | 7M |
| 5 | 🐦 Bird | 6M |
| 6 | 🦎 Reptile | 6M |
| 7 | 🐴 Horse | 2M |
| 8 | 🐠 Saltwater Fish | 2M |
Note: Households can own multiple pets, and are counted for all relevant categories.
Cats rank second, at 47 million households, and these smaller felines are a little less expensive to own at $700/year according to Forbes estimates.
But aside from these two juggernauts, there are plenty of other common pet types found in households across the country.
Freshwater fish can be found in 11 million households, along with small animals—rabbits, hamsters, guinea pigs—in 7 million. Meanwhile, nearly 6 million homes have birds or reptiles.
Pet Ownership is on the Rise in America
Forbes found that 66% of all American households (numbering 87 million) own at least one pet, up from 56% in 1988. One third of these (29 million) own multiple pets.
A combination of factors is driving this increase: rising incomes, delayed childbirth, and of course the impact of the pandemic which nearly cleared out animal shelters across the globe.
America’s loneliness epidemic may also be a factor. Fledgling research has shown that single-individual households with pets recorded lower rates of loneliness during the pandemic than those without a pet.

-

 Brands6 days ago
How Tech Logos Have Evolved Over Time
-

 Demographics2 weeks ago
The Smallest Gender Wage Gaps in OECD Countries
-

 Economy2 weeks ago
Where U.S. Inflation Hit the Hardest in March 2024
-

 Green2 weeks ago
Top Countries By Forest Growth Since 2001
-

 United States2 weeks ago
Ranked: The Largest U.S. Corporations by Number of Employees
-

 Maps2 weeks ago
The Largest Earthquakes in the New York Area (1970-2024)
-

 Green2 weeks ago
Ranked: The Countries With the Most Air Pollution in 2023
-

 Green2 weeks ago
Ranking the Top 15 Countries by Carbon Tax Revenue