Maps
Mapped: The U.S. State that Each Country Trades With the Most
Article/Editing:
Click to view this graphic in a higher-resolution.
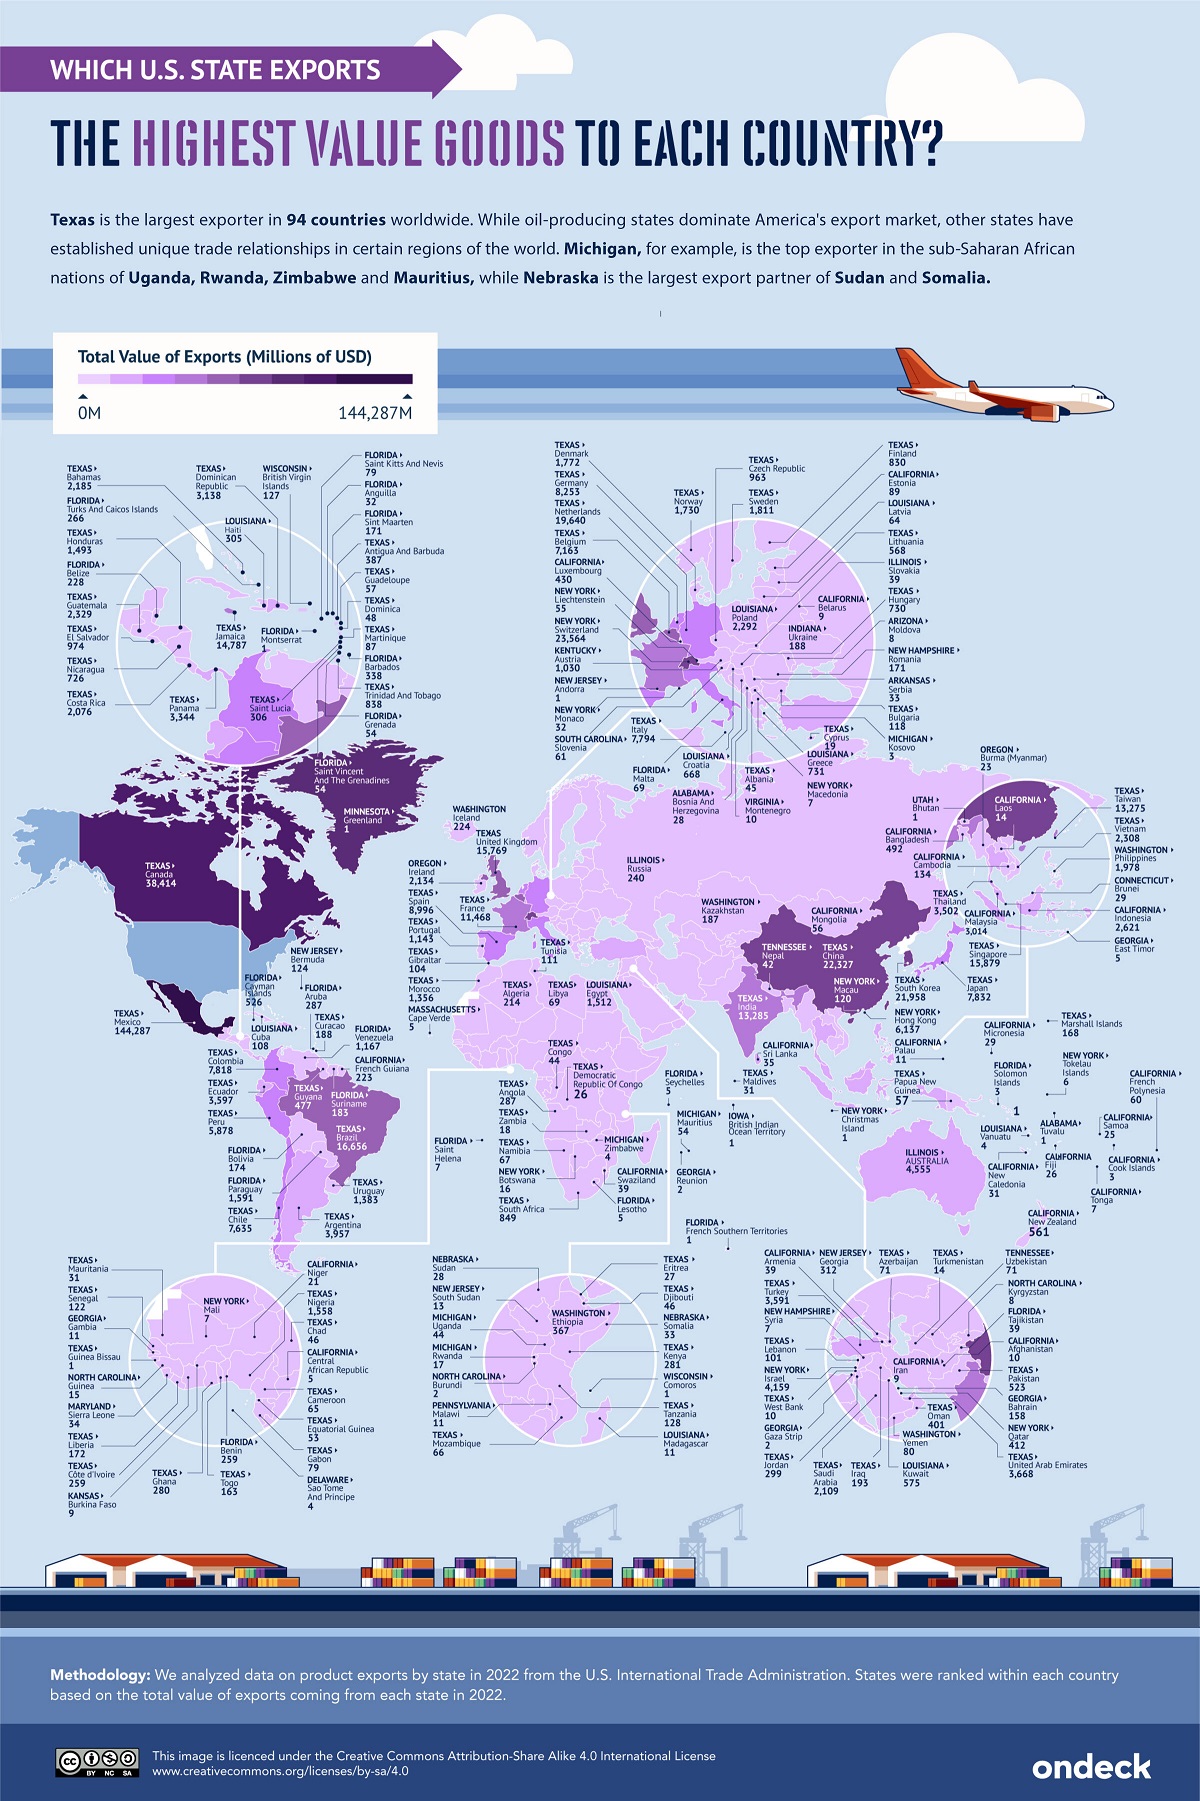
The U.S. State that Each Country Trades With the Most
The U.S. is the world’s second-largest exporter, just behind China. In 2022 alone, America exported some $2.1 trillion, accounting for 8.4% of global exports.
In this graphic by OnDeck, we show the U.S. state that each country receives the most exports from, using data from the U.S. International Trade Administration.
Texas is the Top Exporter
Texas is the leading U.S. exporter to major global economies. The state leads in 94 countries, including Canada, China, the U.K., and Germany. Texas is followed by California (25 countries) and Florida (24 countries).
| State | 2023 Exports (Millions) |
|---|---|
| Texas | $444,608 |
| California | $178,717 |
| Louisiana | $100,197 |
| New York | $97,828 |
| Illinois | $78,724 |
| Unallocated | $73,829 |
| Florida | $68,899 |
| Michigan | $64,904 |
| Washington | $61,209 |
| Indiana | $56,081 |
| Ohio | $55,764 |
| Pennsylvania | $52,876 |
| Georgia | $49,772 |
| New Jersey | $43,334 |
| North Carolina | $42,223 |
| Kentucky | $40,212 |
| Tennessee | $38,120 |
| South Carolina | $37,297 |
| Massachusetts | $35,221 |
| Arizona | $28,791 |
| Wisconsin | $28,021 |
| Oregon | $27,718 |
| Alabama | $27,447 |
| Minnesota | $24,920 |
| Puerto Rico | $22,493 |
| Virginia | $22,395 |
| Iowa | $18,439 |
| Maryland | $18,360 |
| Missouri | $17,858 |
| Utah | $17,388 |
| Connecticut | $15,825 |
| Mississippi | $14,305 |
| Kansas | $14,148 |
| Colorado | $10,378 |
| Nevada | $9,533 |
| Nebraska | $7,987 |
| New Hampshire | $7,638 |
| North Dakota | $7,520 |
| Oklahoma | $6,511 |
| Arkansas | $6,450 |
| West Virginia | $5,652 |
| Alaska | $5,244 |
| New Mexico | $4,940 |
| Delaware | $4,921 |
| Idaho | $4,011 |
| Virgin Islands | $3,403 |
| Rhode Island | $3,016 |
| Maine | $2,951 |
| South Dakota | $2,399 |
| Montana | $2,231 |
| Wyoming | $2,143 |
| Vermont | $1,991 |
| District of Columbia | $1,746 |
| Hawaii | $570 |
Exports from Texas to Mexico have an annual value of $144.29 billion—the highest value of exports from a U.S. state to any country. From this total, Texas exports $33.63 billion in Petroleum & Coal Products to Mexico yearly, the highest value of any single product category from a state to another country.
While oil-producing states like Texas, New Mexico, and North Dakota dominate America’s export market, other states have established unique trade relationships in some regions.
Michigan, for example, exports $15.37 billion in Transportation Equipment to Canada. These include passenger vehicles and trucks, as well as parts.
Australia imports $4.56 billion in goods from Illinois each year, more than from any other U.S. state.
New York State’s exports to Switzerland reached $23.56 billion in 2022. Over three-quarters of this trade is in the category of Primary Metal Manufactures, which includes upstream metal products such as closures, castings, pipes, tubes, wires, and springs.
Hong Kong also counts New York as the state from which it imports the most.

This article was published as a part of Visual Capitalist's Creator Program, which features data-driven visuals from some of our favorite Creators around the world.


Demographics
Mapped: U.S. Immigrants by Region
This map shows which regions U.S. immigrants came from, highlighting Asia and Latin America as the biggest sources.


Breaking Down America’s Immigrant Population
This was originally posted on our Voronoi app. Download the app for free on iOS or Android and discover incredible data-driven charts from a variety of trusted sources.
The United States is home to more immigrants than any other nation, surpassing the combined totals of the next four countries: Germany, Saudi Arabia, Russia, and the United Kingdom.
To add context to this impressive fact, we’ve illustrated the regions from which U.S. immigrants originated. “Immigrants” in this context refers to individuals who are residing in the United States but were not U.S. citizens at birth.
These statistics were sourced from the Migration Policy Institute, which analyzed data from the U.S. Census Bureau’s 2022 American Community Survey (ACS).
U.S. Immigrants by Region
From this graphic, we can see that Asia and Latin America emerge as the primary sources of immigration, collectively accounting for 81% of America’s 46.2 million immigrants.
| Region | # of Immigrants | % of Total |
|---|---|---|
| Europe | 4,728,948 | 10 |
| Asia | 14,349,080 | 31 |
| Africa | 2,752,965 | 6 |
| Oceania | 288,560 | 1 |
| Northern America | 828,702 | 2 |
| Latin America | 23,233,834 | 50 |
| Total | 46,182,089 | 100 |
Latin America alone contributes half of the immigrant population. Mexico stands out as the largest contributor to U.S. immigration, with 10.7 million immigrants, attributable to its geographical proximity and historical ties.
Economic factors, including wage disparity and employment opportunities, drive many Mexicans to seek better prospects north of the border.
From Asia, the two largest country sources are China (2.2 million) and India (2.8 million).
Learn More About U.S. Immigration From Visual Capitalist
If you enjoyed this post, be sure to check out Why Do People Immigrate to the U.S.? This visualization shows the different reasons why immigrants chose to come to America in 2021.

-

 Energy4 days ago
Who’s Building the Most Solar Energy?
-

 Wealth2 weeks ago
Charted: Which Country Has the Most Billionaires in 2024?
-

 Markets2 weeks ago
The Top Private Equity Firms by Country
-

 Jobs1 week ago
The Best U.S. Companies to Work for According to LinkedIn
-

 Economy1 week ago
Ranked: The Top 20 Countries in Debt to China
-

 Misc1 week ago
Charted: Trust in Government Institutions by G7 Countries
-

 Energy1 week ago
Mapped: The Age of Energy Projects in Interconnection Queues, by State
-

 Mining1 week ago
Visualizing Global Gold Production in 2023