Misc
Animation: The Most Popular Websites by Web Traffic (1993-2022)
Article/Editing:
The Most Popular Websites Since 1993
Over the last three decades, the internet has grown at a mind-bending pace.
In 1993, there were fewer than 200 websites available on the World Wide Web. Fast forward to 2022, and that figure has grown to 2 billion.
This animated graphic by James Eagle provides a historical look at the evolution of the internet, showing the most popular websites over the years from 1993 to 2022.
The 90s to Early 2000s: Dial-Up Internet
It was possible to go on the proto-internet as early as the 1970s, but the more user-centric and widely accessible version we think of today didn’t really materialize until the early 1990s using dial-up modems.
Dial-up gave users access to the web through a modem that was connected to an active telephone line. There were several different portals in the 1990s for internet use, such as Prodigy and CompuServe, but AOL quickly became the most popular.
AOL held its top spot as the most visited website for nearly a decade. By June 2000, the online portal was getting over 400 million monthly visits. For context, there were about 413 million internet users around the world at that time.
| Rank | Website | Monthly Visits (May 2000) |
|---|---|---|
| 1 | AOL | 400,891,812 |
| 2 | Yahoo | 387,573,587 |
| 3 | MSN | 354,239,803 |
| 4 | eBay | 116,101,785 |
| 5 | Lycos | 116,064,930 |
But when broadband internet hit the market and made dial-up obsolete, AOL lost its footing, and a new website took the top spot—Yahoo.
The Mid 2000s: Yahoo vs. Google
Founded in 1994, Yahoo started off as a web directory that was originally called “Jerry and David’s Guide to the World Wide Web.”
When the company started to pick up steam, its name changed to Yahoo, which became a backronym that stands for “Yet Another Hierarchical Officious Oracle.”
Yahoo grew fast and by the early 2000s, it became the most popular website on the internet. It held its top spot for several years—by April 2004, Yahoo was receiving 5.6 billion monthly visits.
| Rank | Website | Monthly Visits (April 2004) |
|---|---|---|
| 1 | Yahoo | 5,658,032,268 |
| 2 | MSN | 1,838,700,057 |
| 3 | 1,318,276,780 | |
| 4 | AOL | 905,009,947 |
| 5 | eBay | 805,474,705 |
But Google was close on its heels. Founded in 1998, Google started out as a simpler and more efficient search engine, and the website quickly gained traction.
Funny enough, Google was actually Yahoo’s default search engine in the early 2000s until Yahoo dropped Google so it could use its own search engine technology in 2004.
For the next few years, Google and Yahoo competed fiercely, and both names took turns at the top of the most popular websites list. Then, in the 2010s, Yahoo’s trajectory started to head south after a series of missed opportunities and unsuccessful moves.
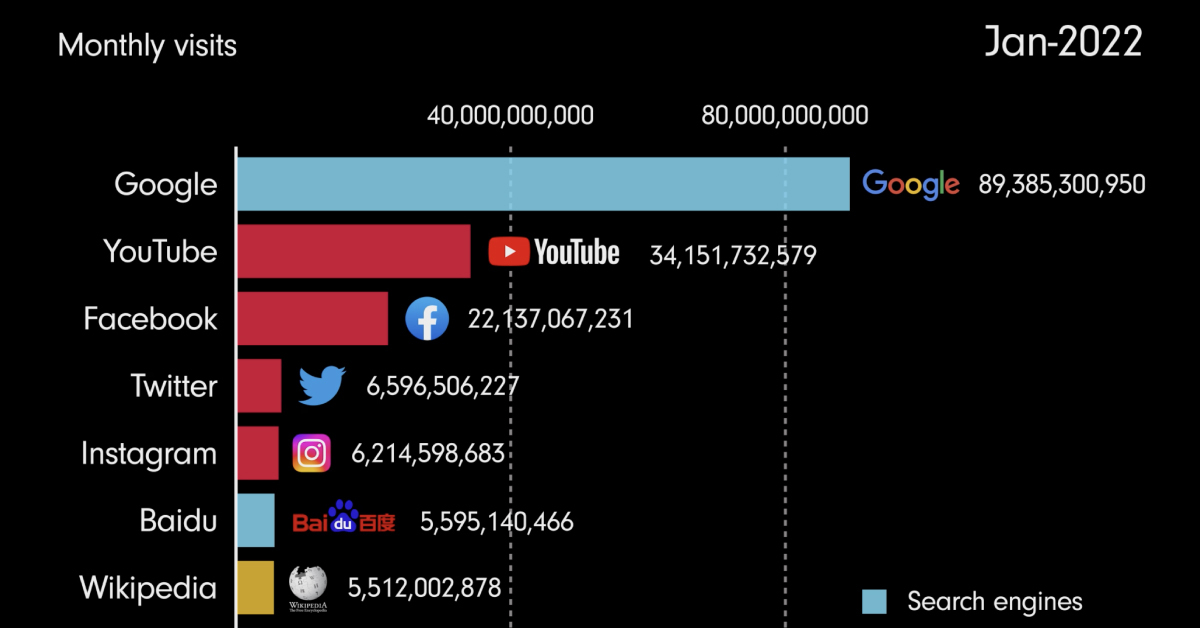
This cemented Google’s place at the top, and the website is still the most popular website as of January 2022.
The Late 2000s, Early 2010s: Social Media Enters the Chat
While Google has held its spot at the top for nearly two decades, it’s worth highlighting the emergence of social media platforms like YouTube and Facebook.
YouTube and Facebook certainly weren’t the first social media platforms to gain traction. MySpace had a successful run back in 2007—at one point, it was the third most popular website on the World Wide Web.
| Rank | Website | Monthly Visits (Jan 2007) |
|---|---|---|
| 1 | 7,349,521,929 | |
| 2 | Yahoo | 5,169,762,311 |
| 3 | MySpace | 1,276,515,128 |
| 4 | MSN | 1,259,467,102 |
| 5 | eBay | 957,928,554 |
But YouTube and Facebook marked a new era for social media platforms, partly because of their impeccable timing. Both platforms entered the scene around the same time that smartphone innovations were turning the mobile phone industry on its head. The iPhone’s design, and the introduction of the App store in 2008, made it easier than ever to access the internet via your mobile device.
As of January 2022, YouTube and Facebook are still the second and third most visited websites on the internet.
The 2020s: Google is Now Synonymous With the Internet
Google is the leading search engine by far, making up about 90% of all web, mobile, and in-app searches.
What will the most popular websites be in a few years? Will Google continue to hold the top spot? There are no signs of the internet giant slowing down anytime soon, but if history has taught us anything, it’s that things change. And no one should get too comfortable at the top.

This article was published as a part of Visual Capitalist's Creator Program, which features data-driven visuals from some of our favorite Creators around the world.


Demographics
Mapped: U.S. Immigrants by Region
This map shows which regions U.S. immigrants came from, highlighting Asia and Latin America as the biggest sources.


Breaking Down America’s Immigrant Population
This was originally posted on our Voronoi app. Download the app for free on iOS or Android and discover incredible data-driven charts from a variety of trusted sources.
The United States is home to more immigrants than any other nation, surpassing the combined totals of the next four countries: Germany, Saudi Arabia, Russia, and the United Kingdom.
To add context to this impressive fact, we’ve illustrated the regions from which U.S. immigrants originated. “Immigrants” in this context refers to individuals who are residing in the United States but were not U.S. citizens at birth.
These statistics were sourced from the Migration Policy Institute, which analyzed data from the U.S. Census Bureau’s 2022 American Community Survey (ACS).
U.S. Immigrants by Region
From this graphic, we can see that Asia and Latin America emerge as the primary sources of immigration, collectively accounting for 81% of America’s 46.2 million immigrants.
| Region | # of Immigrants | % of Total |
|---|---|---|
| Europe | 4,728,948 | 10 |
| Asia | 14,349,080 | 31 |
| Africa | 2,752,965 | 6 |
| Oceania | 288,560 | 1 |
| Northern America | 828,702 | 2 |
| Latin America | 23,233,834 | 50 |
| Total | 46,182,089 | 100 |
Latin America alone contributes half of the immigrant population. Mexico stands out as the largest contributor to U.S. immigration, with 10.7 million immigrants, attributable to its geographical proximity and historical ties.
Economic factors, including wage disparity and employment opportunities, drive many Mexicans to seek better prospects north of the border.
From Asia, the two largest country sources are China (2.2 million) and India (2.8 million).
Learn More About U.S. Immigration From Visual Capitalist
If you enjoyed this post, be sure to check out Why Do People Immigrate to the U.S.? This visualization shows the different reasons why immigrants chose to come to America in 2021.

-

 Energy5 days ago
Who’s Building the Most Solar Energy?
-

 Wealth2 weeks ago
Charted: Which Country Has the Most Billionaires in 2024?
-

 Markets2 weeks ago
The Top Private Equity Firms by Country
-

 Jobs2 weeks ago
The Best U.S. Companies to Work for According to LinkedIn
-

 Economy1 week ago
Ranked: The Top 20 Countries in Debt to China
-

 Misc1 week ago
Charted: Trust in Government Institutions by G7 Countries
-

 Energy1 week ago
Mapped: The Age of Energy Projects in Interconnection Queues, by State
-

 Mining1 week ago
Visualizing Global Gold Production in 2023