Technology
Which Countries are Granted the Most New Patents?
Article/Editing:
Click to view this graphic in a higher-resolution.
Which Countries are Granted the Most New Patents?
Every year, the UN’s World Intellectual Property Organization (WIPO) tracks hundreds of thousands of patents across industries.
These patents grant their inventors exclusive intellectual property rights over their creations. They encourage new ideas, spur scientific development, and lead to new technologies and entire sectors being born.
However, the number of patents granted varies greatly across nations. When viewing the origin of each patent’s applicant, we see a handful of countries dominating certain industries.
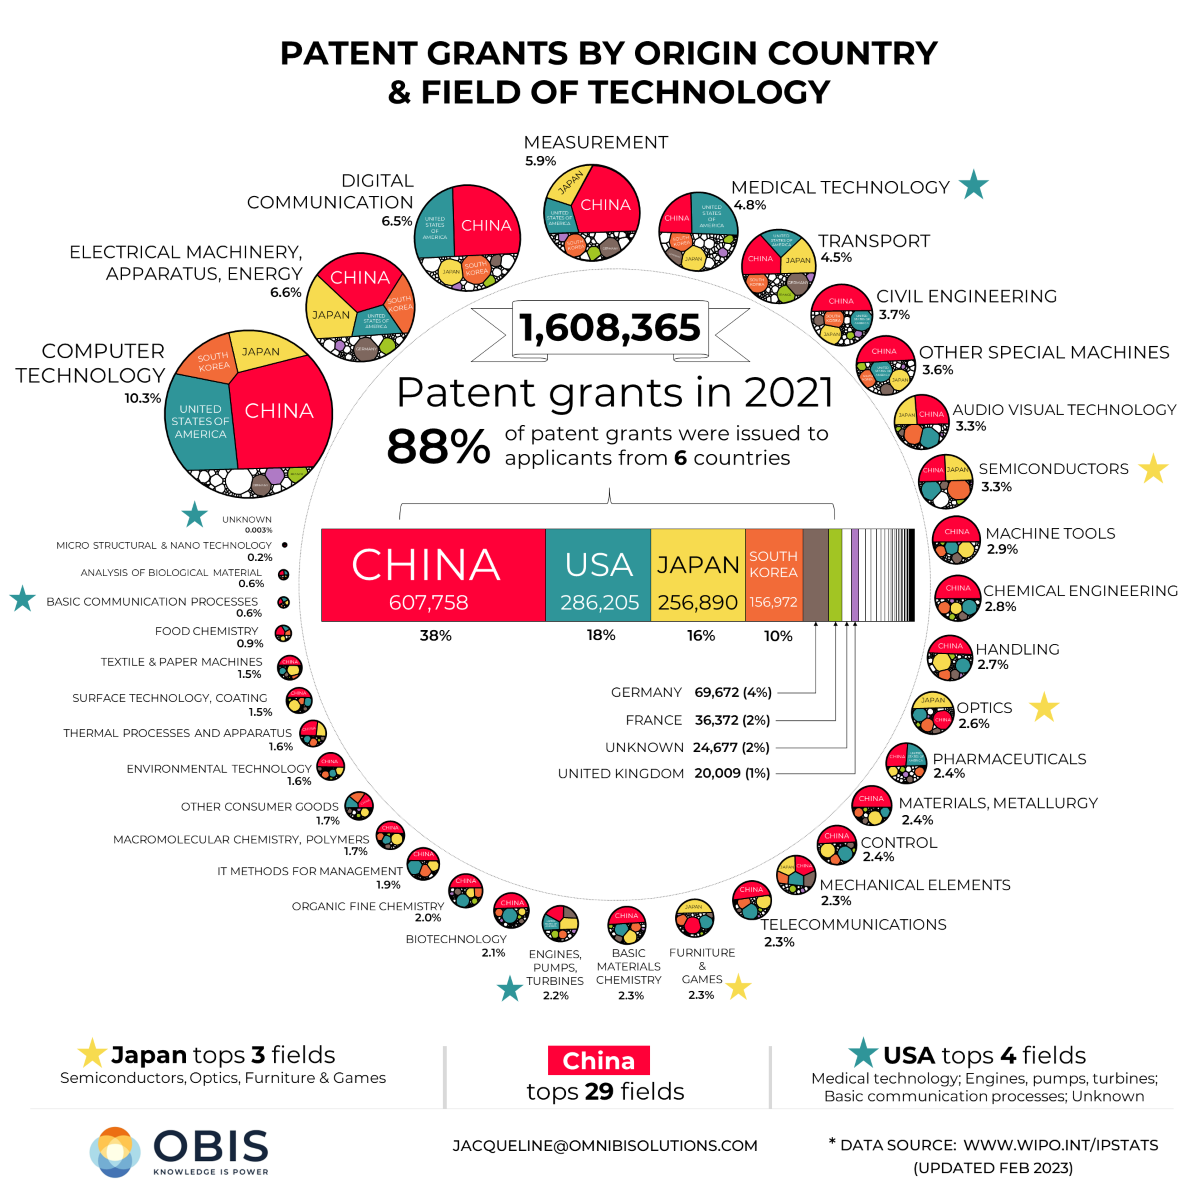
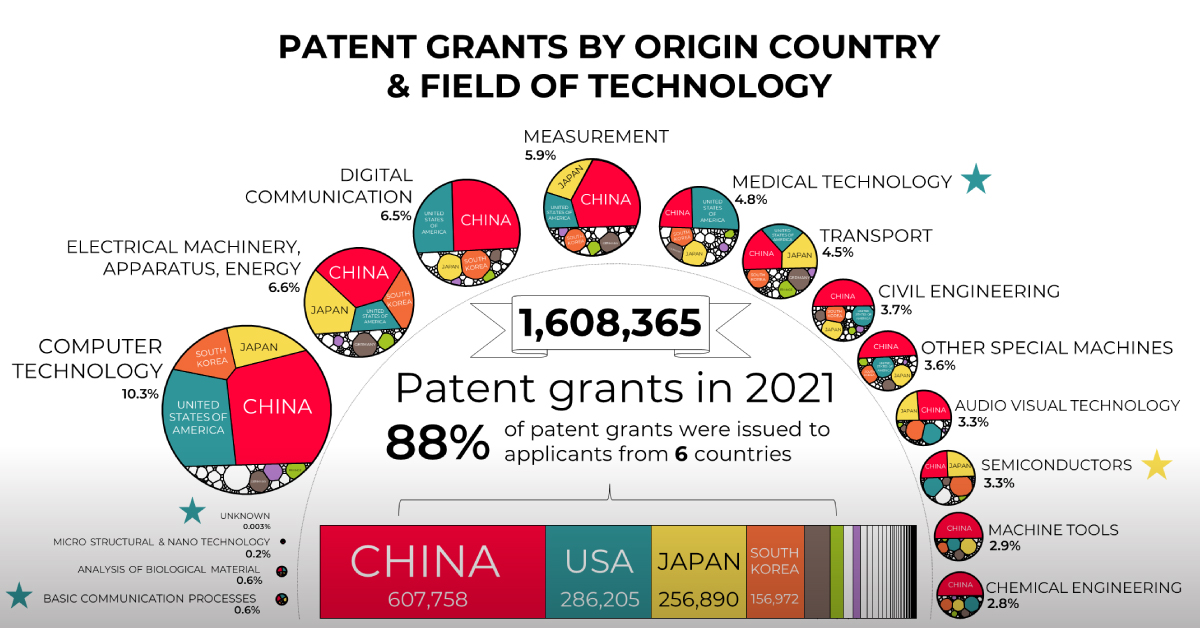
In this graphic, Jacqueline Ann DeStefano-Tangorra uses 2021 WIPO data to showcase which countries were granted the most new patents, along with their sector categorizations.
Countries with the Most New Patents
In 2021, out of 1,608,375 patents across multiple fields, 87% were granted to innovators from just six countries.
| Applicants by Country | Granted Patents (2021) | % of Total |
|---|---|---|
| 🇨🇳 China | 607,758 | 37.8% |
| 🇺🇸 United States | 286,205 | 17.8% |
| 🇯🇵 Japan | 256,890 | 16.0% |
| 🇰🇷 South Korea | 156,972 | 9.8% |
| 🇩🇪 Germany | 69,672 | 4.3% |
| 🇬🇧 United Kingdom | 20,009 | 1.2% |
| ❓ Unknown | 24,677 | 1.5% |
| 🌎 Other Countries | 186,192 | 11.6% |
| World Total | 1,608,375 | 100.0% |
After rapidly increasing its patent output in recent years, China topped the chart in 29 out of 36 total fields including computer technology, electrical machinery, and digital communication. The Chinese government’s focus on innovation led to the nation’s applicants receiving 38% of the 1.6 million patents granted in 2021.
The United States—home to the world’s largest tech companies—came in second with 286,205 granted patents by origin. The U.S. also topped four fields of its own: medical technology, engines and turbines, basic communication processes, and unknown (for inventions that can’t be assigned to a specific field).
Not far behind is Japan with 256,890 granted patents. It dominated the other nations in the fields of semiconductors, optics, and furniture and games, cementing its well-earned reputation of technological innovation.
“Unknown” origin applicants, for which the nationality or country of residence couldn’t be determined for the inventor(s), accounted for 24,677 of granted patents.
The Origin of New Patents by Field
When assessing which technological fields inventors are pursuing in 2021, it’s not unexpected that digital and electrical technologies are in the lead:
| Rank | Main Field of Technology | % of Granted Patents |
|---|---|---|
| 1 | Computer technology | 10.3% |
| 2 | Electrical machinery, apparatus, energy | 6.6% |
| 3 | Digital communication | 6.5% |
| 4 | Measurement | 5.9% |
| 5 | Medical technology | 4.8% |
| 6 | Transport | 4.5% |
| 7 | Civil engineering | 3.7% |
| 8 | Other special machines | 3.6% |
| 9 | Audio visual technology | 3.3% |
| 10 | Semiconductors | 3.3% |
| 11 | Machine tools | 2.9% |
| 12 | Chemical engineering | 2.8% |
| 13 | Handling | 2.7% |
| 14 | Optics | 2.6% |
| 15 | Pharmaceuticals | 2.4% |
| 16 | Materials, metallurgy | 2.4% |
| 17 | Control | 2.4% |
| 18 | Mechanical elements | 2.3% |
| 19 | Telecommunications | 2.3% |
| 20 | Furniture & games | 2.3% |
| 21 | Basic materials chemistry | 2.3% |
| 22 | Engines, pumps, turbines | 2.2% |
| 23 | Biotechnology | 2.1% |
| 24 | Organic fine chemistry | 2.0% |
| 25 | IT methods for management | 1.9% |
| 26 | Macromolecular chemistry, polymers | 1.7% |
| 27 | Other consumer goods | 1.7% |
| 28 | Environmental technology | 1.6% |
| 29 | Thermal Processes and apparatus | 1.6% |
| 30 | Surface technology, coating | 1.5% |
| 31 | Textile & paper machines | 1.5% |
| 32 | Food chemistry | 0.9% |
| 33 | Basic communication processes | 0.6% |
| 34 | Analysis of biological material | 0.6% |
| 35 | Micro structural & nano technology | 0.2% |
| 36 | Unknown | 0.003% |
There are also many patents granted mainly in infrastructure-related fields, which have become all the more important following the COVID-19 pandemic and an increasing focus on trade.
These include medical technology, transport, civil engineering, and semiconductors.
A Tech-Savvy Future
The number of patents granted in 2021 is a testament to the growing importance of innovation around the world.
While a select few nations have dominated the patent landscape so far, there are many others making significant contributions to innovation and intellectual property.
As technology continues to advance and the global economy becomes more interconnected, the importance of intellectual property rights will only continue to grow.

This article was published as a part of Visual Capitalist's Creator Program, which features data-driven visuals from some of our favorite Creators around the world.


Technology
Visualizing AI Patents by Country
See which countries have been granted the most AI patents each year, from 2012 to 2022.


Visualizing AI Patents by Country
This was originally posted on our Voronoi app. Download the app for free on iOS or Android and discover incredible data-driven charts from a variety of trusted sources.
This infographic shows the number of AI-related patents granted each year from 2010 to 2022 (latest data available). These figures come from the Center for Security and Emerging Technology (CSET), accessed via Stanford University’s 2024 AI Index Report.
From this data, we can see that China first overtook the U.S. in 2013. Since then, the country has seen enormous growth in the number of AI patents granted each year.
| Year | China | EU and UK | U.S. | RoW | Global Total |
|---|---|---|---|---|---|
| 2010 | 307 | 137 | 984 | 571 | 1,999 |
| 2011 | 516 | 129 | 980 | 581 | 2,206 |
| 2012 | 926 | 112 | 950 | 660 | 2,648 |
| 2013 | 1,035 | 91 | 970 | 627 | 2,723 |
| 2014 | 1,278 | 97 | 1,078 | 667 | 3,120 |
| 2015 | 1,721 | 110 | 1,135 | 539 | 3,505 |
| 2016 | 1,621 | 128 | 1,298 | 714 | 3,761 |
| 2017 | 2,428 | 144 | 1,489 | 1,075 | 5,136 |
| 2018 | 4,741 | 155 | 1,674 | 1,574 | 8,144 |
| 2019 | 9,530 | 322 | 3,211 | 2,720 | 15,783 |
| 2020 | 13,071 | 406 | 5,441 | 4,455 | 23,373 |
| 2021 | 21,907 | 623 | 8,219 | 7,519 | 38,268 |
| 2022 | 35,315 | 1,173 | 12,077 | 13,699 | 62,264 |
In 2022, China was granted more patents than every other country combined.
While this suggests that the country is very active in researching the field of artificial intelligence, it doesn’t necessarily mean that China is the farthest in terms of capability.
Key Facts About AI Patents
According to CSET, AI patents relate to mathematical relationships and algorithms, which are considered abstract ideas under patent law. They can also have different meaning, depending on where they are filed.
In the U.S., AI patenting is concentrated amongst large companies including IBM, Microsoft, and Google. On the other hand, AI patenting in China is more distributed across government organizations, universities, and tech firms (e.g. Tencent).
In terms of focus area, China’s patents are typically related to computer vision, a field of AI that enables computers and systems to interpret visual data and inputs. Meanwhile America’s efforts are more evenly distributed across research fields.
Learn More About AI From Visual Capitalist
If you want to see more data visualizations on artificial intelligence, check out this graphic that shows which job departments will be impacted by AI the most.

-

 Mining1 week ago
Gold vs. S&P 500: Which Has Grown More Over Five Years?
-

 Markets2 weeks ago
Ranked: The Most Valuable Housing Markets in America
-

 Money2 weeks ago
Which States Have the Highest Minimum Wage in America?
-

 AI2 weeks ago
Ranked: Semiconductor Companies by Industry Revenue Share
-

 Markets2 weeks ago
Ranked: The World’s Top Flight Routes, by Revenue
-

 Countries2 weeks ago
Population Projections: The World’s 6 Largest Countries in 2075
-

 Markets2 weeks ago
The Top 10 States by Real GDP Growth in 2023
-

 Demographics2 weeks ago
The Smallest Gender Wage Gaps in OECD Countries