Misc
Comparing Gun Laws and Gun-Related Deaths Across America
Article/Editing:
Comparing Gun Laws and Gun-Related Deaths Across America
In June 2022, the U.S. Supreme Court’s decision to strike down concealed-gun legislation in New York sent shock waves through the country.
The decision brought renowned attention to the ongoing debate around America’s gun laws—one that Americans have grossly differing views on. This lack of consensus is apparent not just in public opinion, but in legislation, with U.S. firearm regulation varying greatly from state to state.
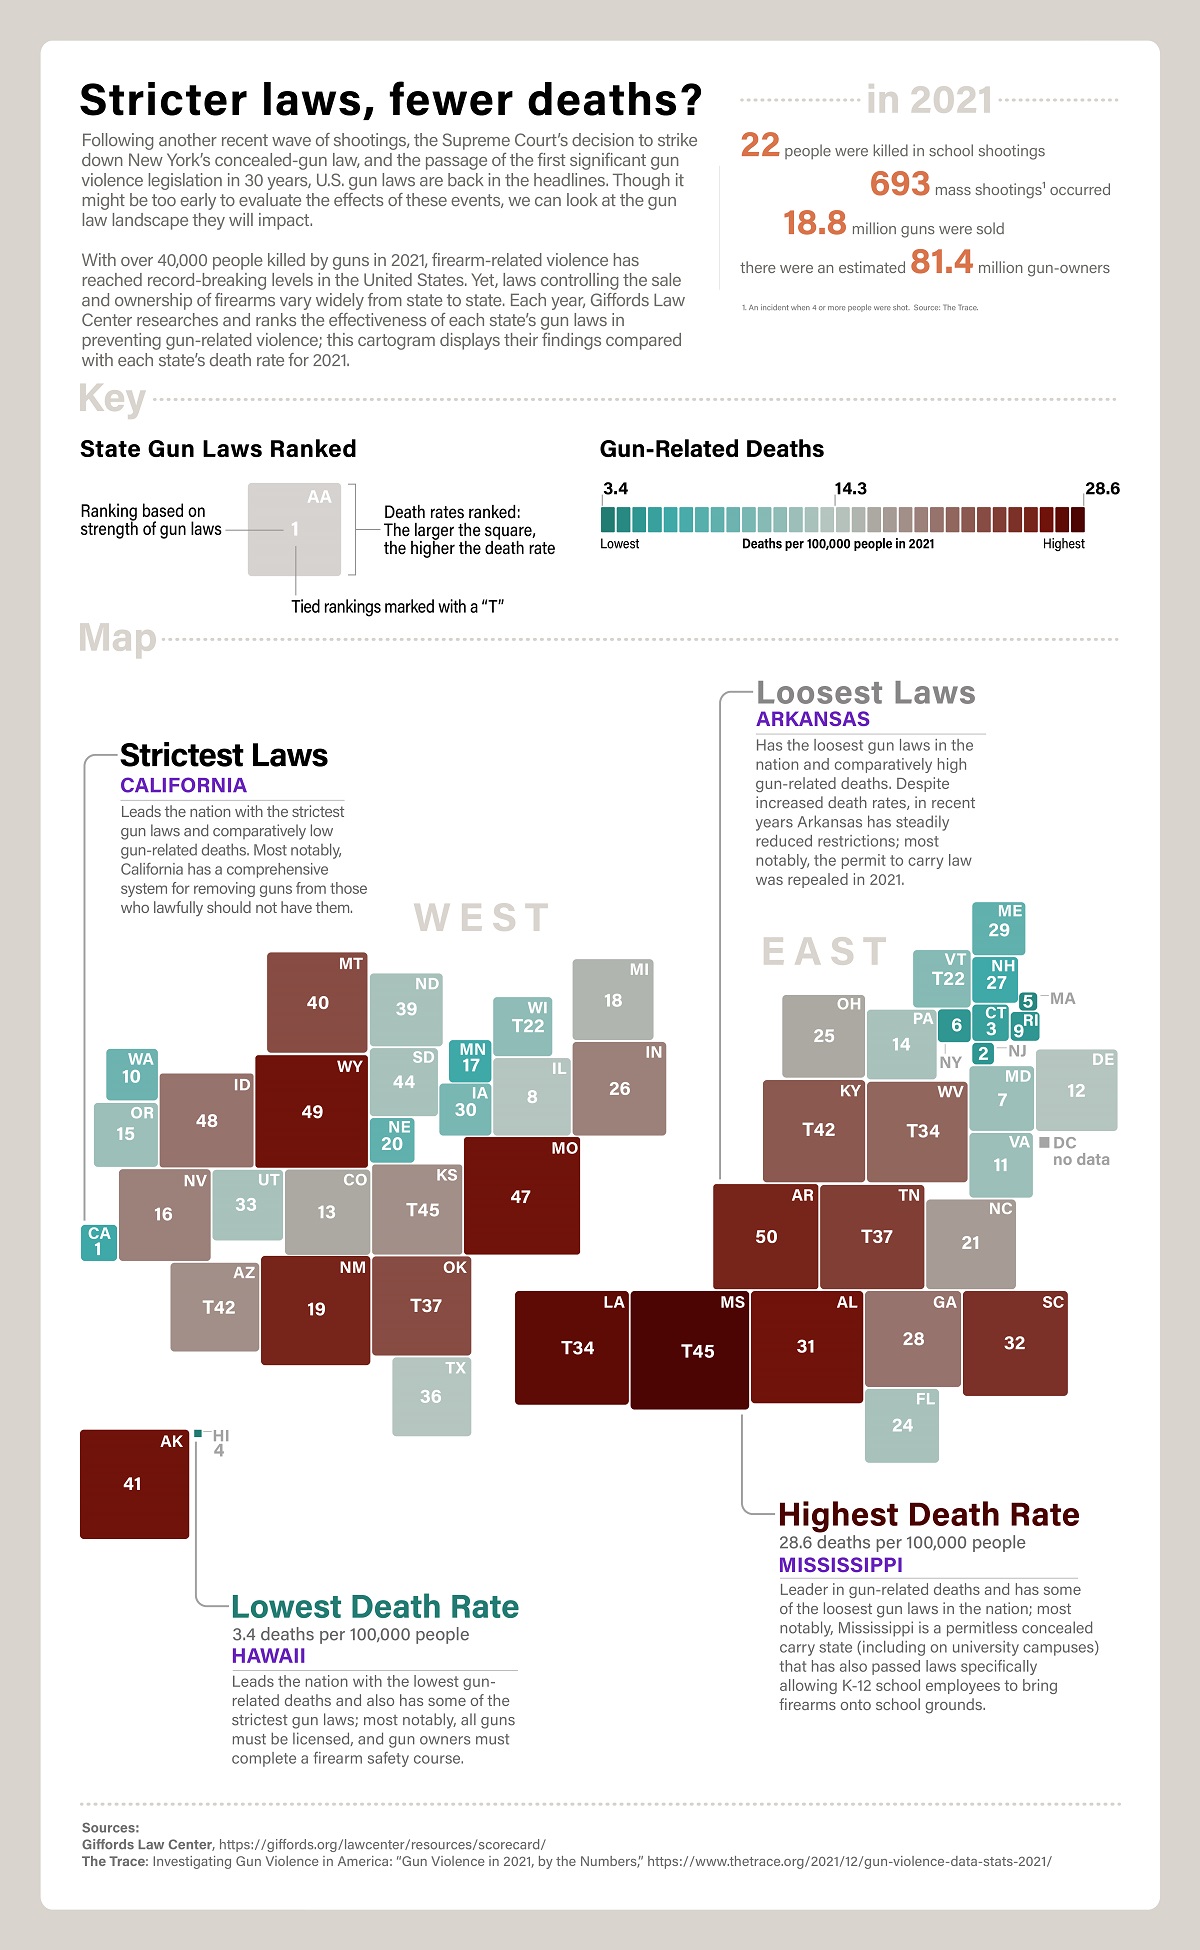
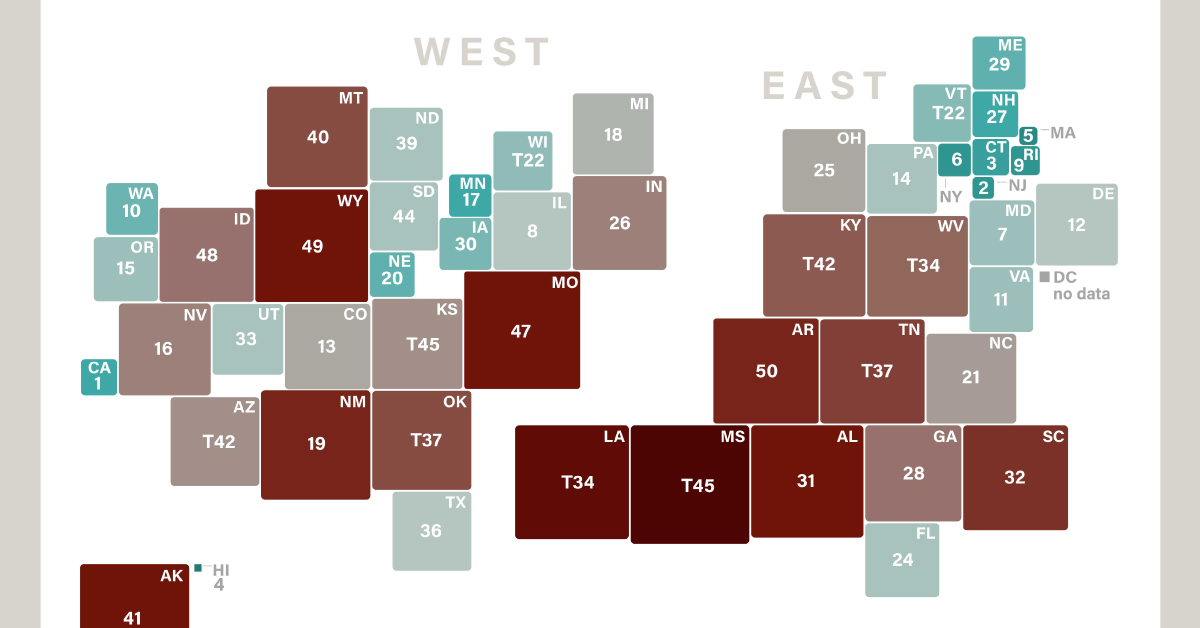
Which states have the strictest (and loosest) gun regulations around? This graphic by Elbie Bentley sets the ground for comparing gun laws across America before the impact of the Supreme Court’s ruling can be fully understood. It uses 2021 data from Giffords Law Center and contrasts against gun-related deaths in each state.
States With The Strictest Gun Laws
Since 2010, researchers at Giffords Law Center have been ranking state gun laws across America and seeing if there’s a correlation between stricter gun laws and lower gun-related deaths.
Here’s a look at the top 10 states with the strictest gun laws and their number of gun-related deaths in 2021:
| Rank | State | Gun-Related Deaths in 2021 (per 100,000 people) | % Difference from National Average |
|---|---|---|---|
| 1 | California | 8.5 | -37% |
| 2 | New Jersey | 5 | -63% |
| 3 | Connecticut | 6 | -56% |
| 4 | Hawaii | 3.4 | -75% |
| 5 | Massachusetts | 3.7 | -73% |
| 6 | New York | 5.3 | -61% |
| 7 | Mayland | 13.5 | -1% |
| 8 | Illinois | 14.1 | +3% |
| 9 | Rhode Island | 5.1 | -62% |
| 10 | Washington | 10.9 | -20% |
California has the strictest gun laws in the country. Some of the state’s most notable legislation is its proactive removal of firearms from people who are facing domestic violence charges, or from people that have domestic abuse protective orders filed against them.
In addition to having the strictest gun laws, California also has a relatively low rate of gun-related deaths, at 8.5 deaths per 100,000 people—37% below the national average.
Apart from Illinois, gun-related deaths in the 10 states with the strictest gun laws are all below the national average, with Hawaii ranking the lowest for gun-related deaths at 3.4 deaths per 100,000 people, or 75% below the national average.
States With The Loosest Gun Laws
On the opposite end of the spectrum, here’s a look at the 10 states with the loosest gun laws, and their number of gun-related deaths per 100,000 people:
| Rank | State | Gun-Related Deaths in 2021 (per 100,000 people) | % Difference from National Average |
|---|---|---|---|
| 41 | Alaska | 23.5 | +73% |
| 42(T) | Arizona | 16.7 | +22% |
| 42(T) | Kentucky | 20.1 | +48% |
| 44 | South Dakota | 13.6 | -0.4% |
| 45(T) | Kansas | 16.9 | +24% |
| 45(T) | Mississippi | 28.6 | +110% |
| 47 | Missouri | 23.9 | +75% |
| 48 | Idaho | 17.6 | +29% |
| 49 | Wyoming | 25.9 | +90% |
| 50 | Arkansas | 22.6 | +66% |
Apart from South Dakota, all states in the bottom 10 have an above-average rate of gun-related deaths. Mississippi has the highest death rate at 28.6 per 100,000, which is 110% above the national average.
In Mississippi, you don’t need a permit to carry a concealed gun—not even on university campuses. And a few years ago, the state passed a law allowing K-12 school employees to bring guns onto school grounds.
Polarizing Opinions and an Uncertain Future
The recent Supreme Court ruling came weeks after dozens were killed in a series of mass shootings across the country—including one in a grocery store in Buffalo, New York, and the other in an elementary school in Uvalde, Texas.
Notably, some states have already reacted to the ruling by altering their gun laws. New York passed new legislation banning guns from notable public places, requiring applicants to prove they can use a gun, and requiring applicants to have their social media accounts reviewed. On the other hand, Maryland loosened its gun laws, directing law enforcement to be less restrictive for concealed carry applicants.
As all of the changes are still happening in rapid session, time will tell what the next annual review of U.S. gun laws shows about the country’s gun regulation landscape.

This article was published as a part of Visual Capitalist's Creator Program, which features data-driven visuals from some of our favorite Creators around the world.


VC+
VC+: Get Our Key Takeaways From the IMF’s World Economic Outlook
A sneak preview of the exclusive VC+ Special Dispatch—your shortcut to understanding IMF’s World Economic Outlook report.

Have you read IMF’s latest World Economic Outlook yet? At a daunting 202 pages, we don’t blame you if it’s still on your to-do list.
But don’t worry, you don’t need to read the whole April release, because we’ve already done the hard work for you.
To save you time and effort, the Visual Capitalist team has compiled a visual analysis of everything you need to know from the report—and our VC+ Special Dispatch is available exclusively to VC+ members. All you need to do is log into the VC+ Archive.
If you’re not already subscribed to VC+, make sure you sign up now to access the full analysis of the IMF report, and more (we release similar deep dives every week).
For now, here’s what VC+ members get to see.
Your Shortcut to Understanding IMF’s World Economic Outlook
With long and short-term growth prospects declining for many countries around the world, this Special Dispatch offers a visual analysis of the key figures and takeaways from the IMF’s report including:
- The global decline in economic growth forecasts
- Real GDP growth and inflation forecasts for major nations in 2024
- When interest rate cuts will happen and interest rate forecasts
- How debt-to-GDP ratios have changed since 2000
- And much more!

Get the Full Breakdown in the Next VC+ Special Dispatch
VC+ members can access the full Special Dispatch by logging into the VC+ Archive, where you can also check out previous releases.
Make sure you join VC+ now to see exclusive charts and the full analysis of key takeaways from IMF’s World Economic Outlook.
Don’t miss out. Become a VC+ member today.
What You Get When You Become a VC+ Member
VC+ is Visual Capitalist’s premium subscription. As a member, you’ll get the following:
- Special Dispatches: Deep dive visual briefings on crucial reports and global trends
- Markets This Month: A snappy summary of the state of the markets and what to look out for
- The Trendline: Weekly curation of the best visualizations from across the globe
- Global Forecast Series: Our flagship annual report that covers everything you need to know related to the economy, markets, geopolitics, and the latest tech trends
- VC+ Archive: Hundreds of previously released VC+ briefings and reports that you’ve been missing out on, all in one dedicated hub
You can get all of the above, and more, by joining VC+ today.

-

 Mining1 week ago
Gold vs. S&P 500: Which Has Grown More Over Five Years?
-

 Markets2 weeks ago
Ranked: The Most Valuable Housing Markets in America
-

 Money2 weeks ago
Which States Have the Highest Minimum Wage in America?
-

 AI2 weeks ago
Ranked: Semiconductor Companies by Industry Revenue Share
-

 Markets2 weeks ago
Ranked: The World’s Top Flight Routes, by Revenue
-

 Demographics2 weeks ago
Population Projections: The World’s 6 Largest Countries in 2075
-

 Markets2 weeks ago
The Top 10 States by Real GDP Growth in 2023
-

 Demographics2 weeks ago
The Smallest Gender Wage Gaps in OECD Countries