Agriculture
Charted: U.S. Egg Prices More Than Double in 2022
Article/Editing:
Charted: U.S. Egg Prices Double in 2022
Eggs are a staple food for many countries around the world, and the U.S. is no exception. Americans eat between 250‒280 eggs a year on average.
Eggs are also easy to cook, protein-dense and supply many daily vitamins needed for healthy living, making them a popular meal or ingredient. So when egg prices rise, people notice.
Vizalytiq charted the rapid rise of egg prices in the U.S. during 2022, using data from the U.S. Bureau of Labor and Statistics (BLS).
Eggs-asperating Prices
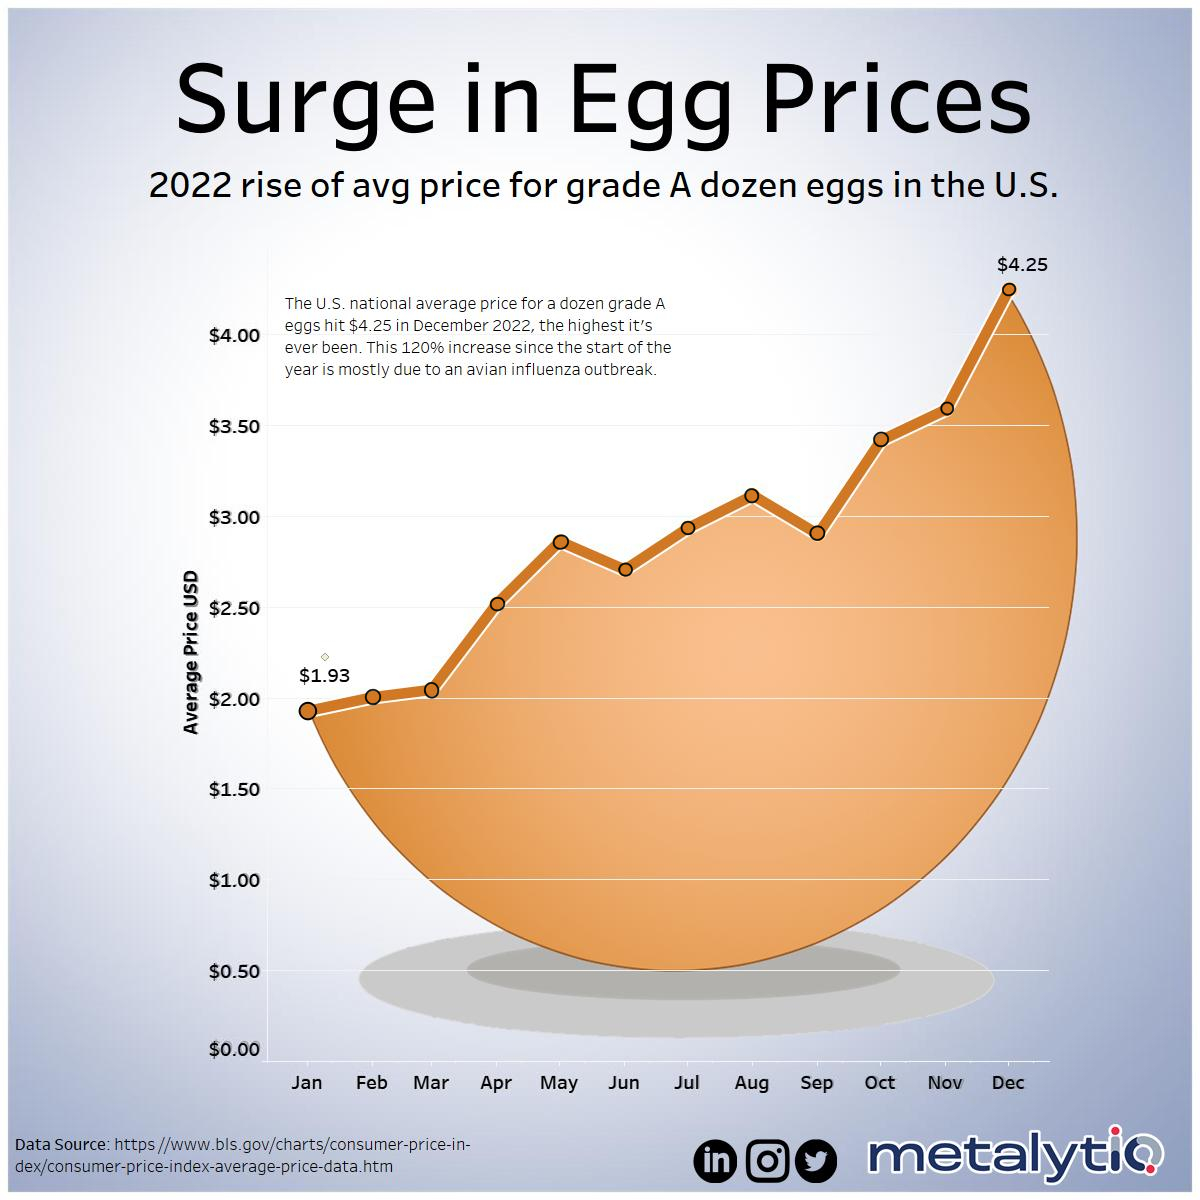
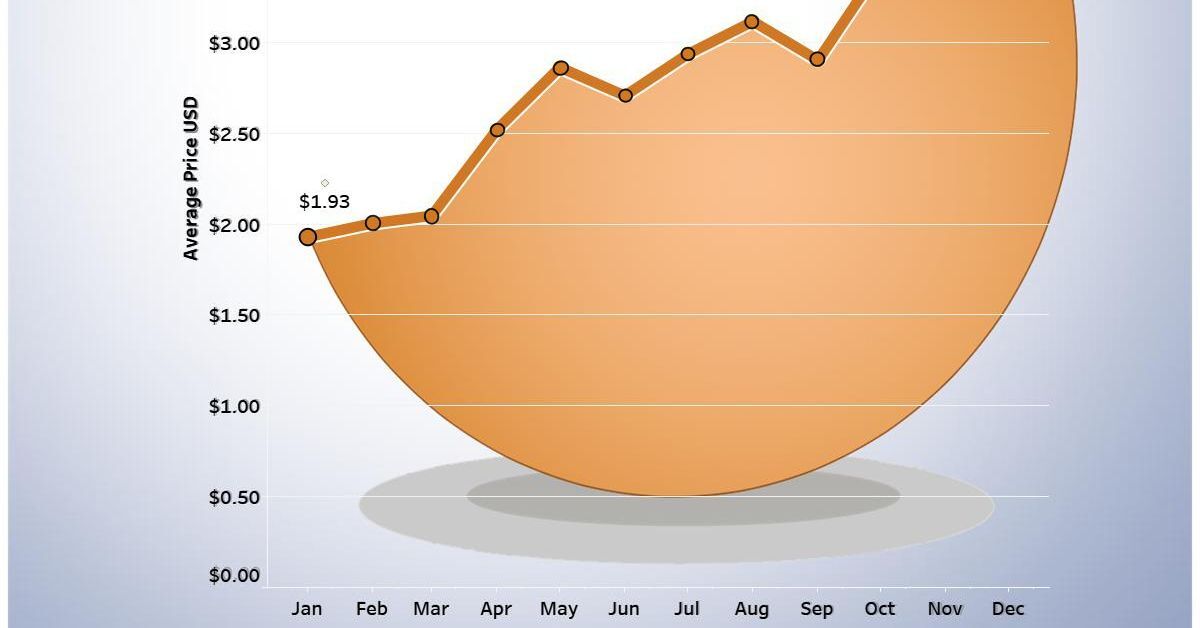
Over the course of 12 months, the national average price for a dozen large Grade A eggs more than doubled, to $4.25 in December from $1.93 in January.
| Egg Prices Per Month (2022) | Price per dozen |
|---|---|
| January | $1.30 |
| February | $2.10 |
| March | $2.50 |
| April | $2.52 |
| May | $2.86 |
| June | $2.71 |
| July | $2.94 |
| August | $3.12 |
| September | $2.90 |
| October | $3.42 |
| November | $3.59 |
| December | $4.25 |
The biggest culprit has been an avian flu outbreak that resulted in 43 million chickens culled to prevent the spread of the disease.
This led to a severe shortfall in egg supply. Egg inventories in December had fallen by one-third compared to January. Combined with increasing demand during the holiday season, prices skyrocketed and empty shelves became apparent in some states.
This is not the first time avian flu has disrupted the industry.. In 2015, a similar outbreak pushed egg prices up 40% in nine months, reaching a high of $2.97 per dozen eggs in September 2015.
Will Egg Prices Drop in 2023?
Avian flu isn’t the only storm the egg industry has been facing in 2022.
The prices of soybean and corn—the main components of bird feed—account for half of the cost of eggs. They’ve been heavily affected by the war in Ukraine, which has driven grain prices higher.
In the near-term, egg prices are expected to remain high. Containing the avian flu outbreak will remain the biggest factor in determining the prices, but as suppliers increase production, prices may cool off a little in 2023.

This article was published as a part of Visual Capitalist's Creator Program, which features data-driven visuals from some of our favorite Creators around the world.


Markets
The World’s Top Cocoa Producing Countries
Here are the largest cocoa producing countries globally—from Côte d’Ivoire to Brazil—as cocoa prices hit record highs.
The World’s Top Cocoa Producing Countries
This was originally posted on our Voronoi app. Download the app for free on iOS or Android and discover incredible data-driven charts from a variety of trusted sources.
West Africa is home to the largest cocoa producing countries worldwide, with 3.9 million tonnes of production in 2022.
In fact, there are about one million farmers in Côte d’Ivoire supplying cocoa to key customers such as Nestlé, Mars, and Hershey. But the massive influence of this industry has led to significant forest loss to plant cocoa trees.
This graphic shows the leading producers of cocoa, based on data from the UN FAO.
Global Hotspots for Cocoa Production
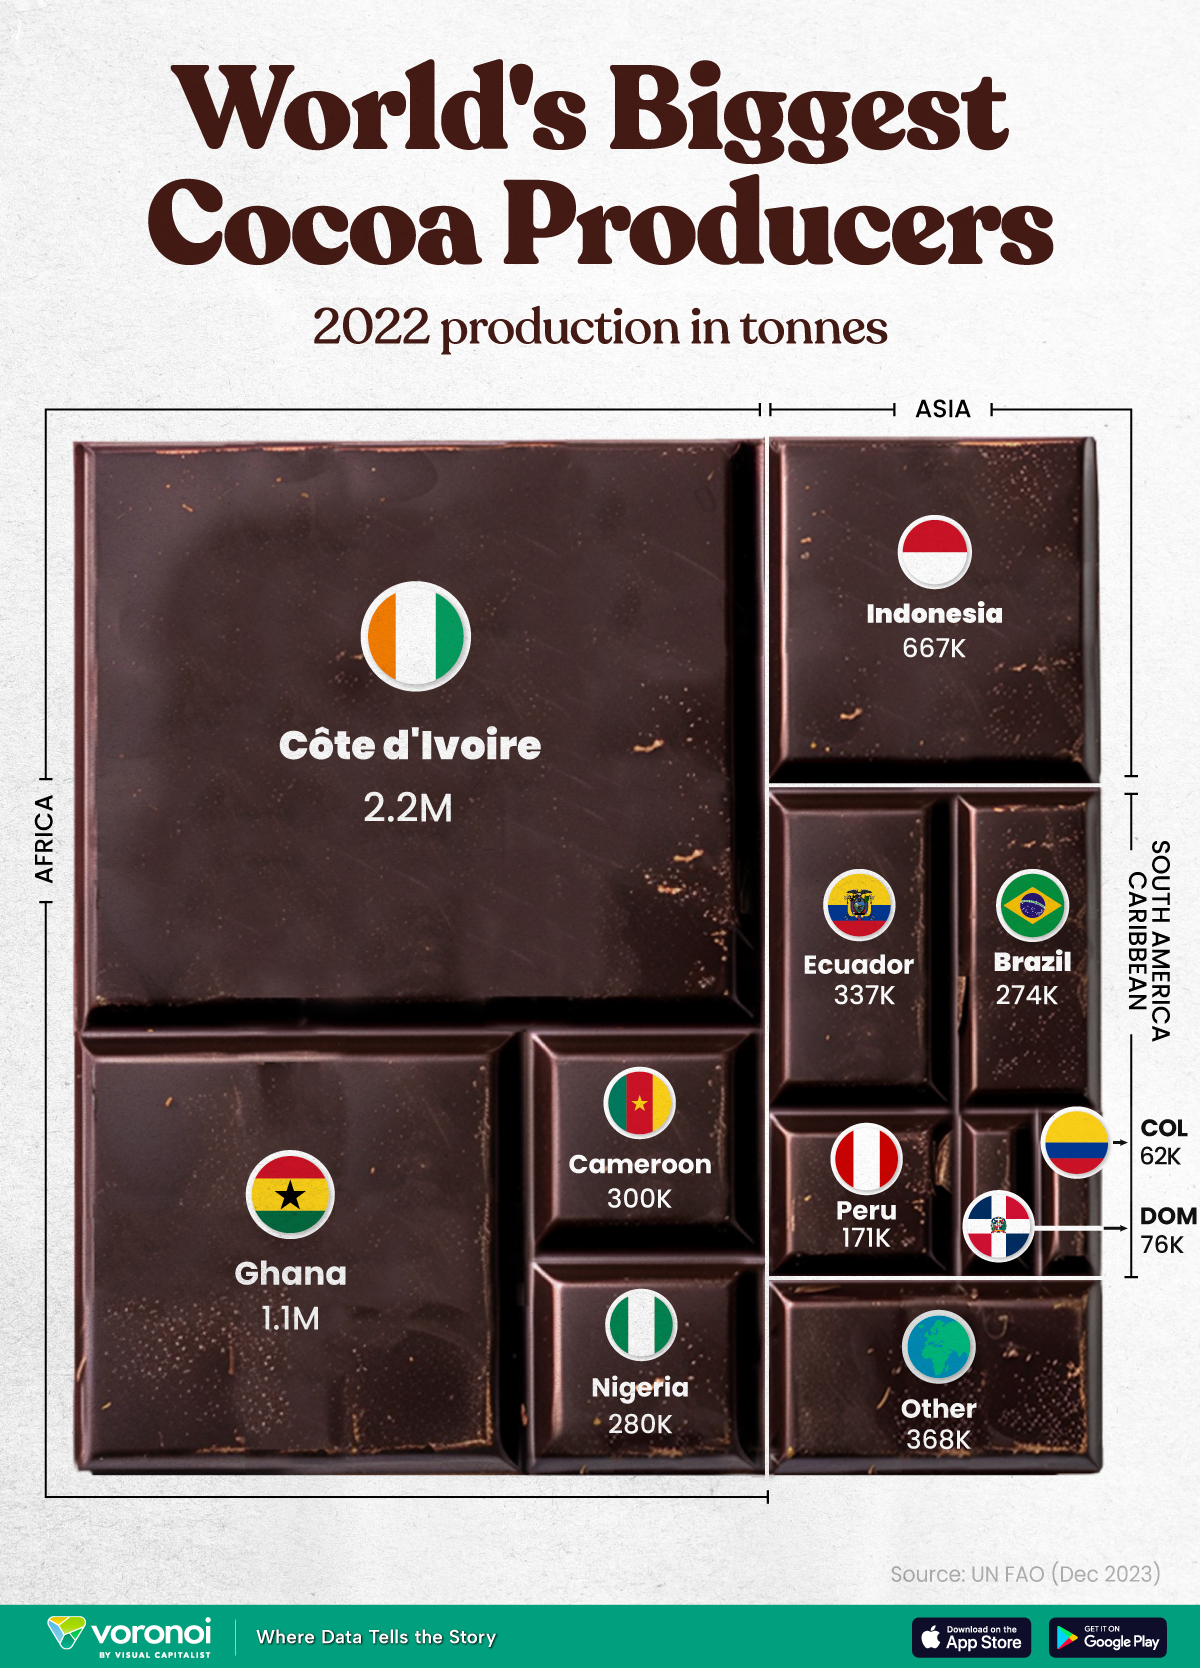
Below, we break down the top cocoa producing countries as of 2022:
| Country | 2022 Production, Tonnes |
|---|---|
| 🇨🇮 Côte d'Ivoire | 2.2M |
| 🇬🇭 Ghana | 1.1M |
| 🇮🇩 Indonesia | 667K |
| 🇪🇨 Ecuador | 337K |
| 🇨🇲 Cameroon | 300K |
| 🇳🇬 Nigeria | 280K |
| 🇧🇷 Brazil | 274K |
| 🇵🇪 Peru | 171K |
| 🇩🇴 Dominican Republic | 76K |
| 🌍 Other | 386K |
With 2.2 million tonnes of cocoa in 2022, Côte d’Ivoire is the world’s largest producer, accounting for a third of the global total.
For many reasons, the cocoa trade in Côte d’Ivoire and Western Africa has been controversial. Often, farmers make about 5% of the retail price of a chocolate bar, and earn $1.20 each day. Adding to this, roughly a third of cocoa farms operate on forests that are meant to be protected.
As the third largest producer, Indonesia produced 667,000 tonnes of cocoa with the U.S., Malaysia, and Singapore as major importers. Overall, small-scale farmers produce 95% of cocoa in the country, but face several challenges such as low pay and unwanted impacts from climate change. Alongside aging trees in the country, these setbacks have led productivity to decline.
In South America, major producers include Ecuador and Brazil. In the early 1900s, Ecuador was the world’s largest cocoa producing country, however shifts in the global marketplace and crop disease led its position to fall. Today, the country is most known for its high-grade single-origin chocolate, with farms seen across the Amazon rainforest.
Altogether, global cocoa production reached 6.5 million tonnes, supported by strong demand. On average, the market has grown 3% annually over the last several decades.

-

 Mining1 week ago
Gold vs. S&P 500: Which Has Grown More Over Five Years?
-

 Markets2 weeks ago
Ranked: The Most Valuable Housing Markets in America
-

 Money2 weeks ago
Which States Have the Highest Minimum Wage in America?
-

 AI2 weeks ago
Ranked: Semiconductor Companies by Industry Revenue Share
-

 Markets2 weeks ago
Ranked: The World’s Top Flight Routes, by Revenue
-

 Countries2 weeks ago
Population Projections: The World’s 6 Largest Countries in 2075
-

 Markets2 weeks ago
The Top 10 States by Real GDP Growth in 2023
-

 Demographics2 weeks ago
The Smallest Gender Wage Gaps in OECD Countries