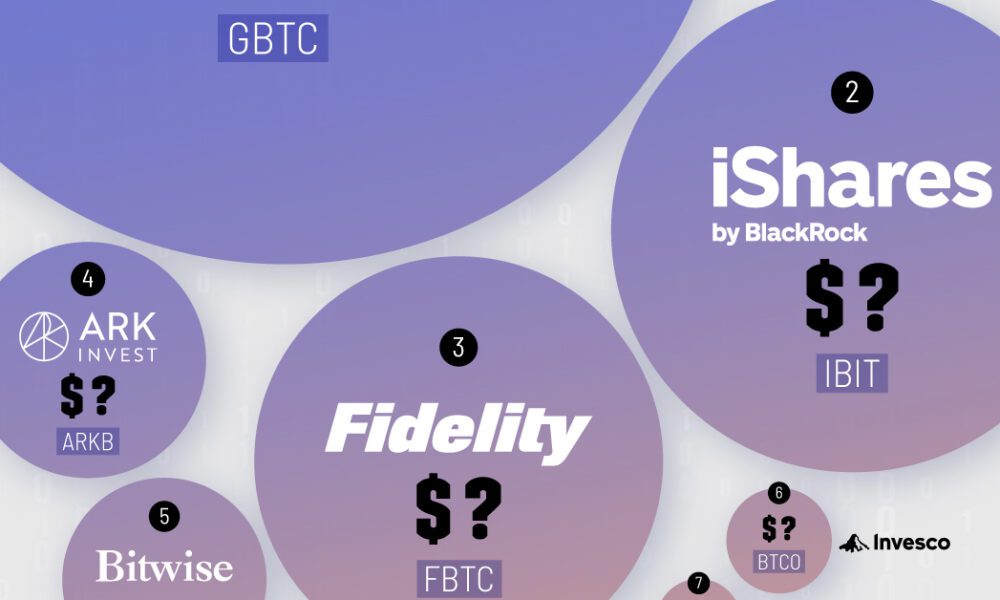
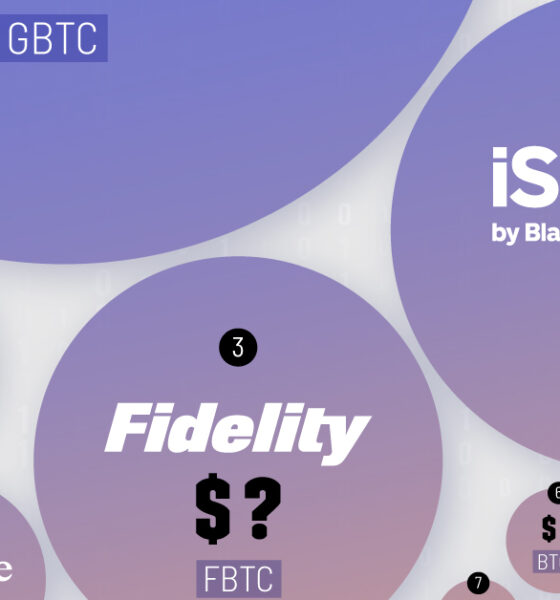
In this graphic, we rank the top eight Bitcoin ETFs in the U.S. by their total assets under management (AUM).
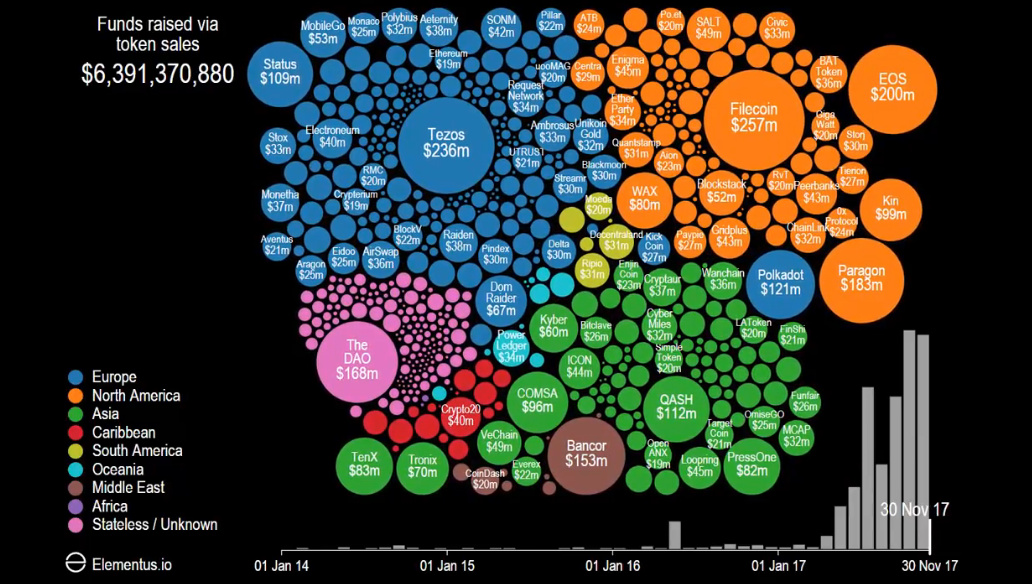
All is quiet for about three years of this incredible animated timeline - but by 2017, there's an ICO explosion as billions of dollars are poured...
From the Chinese invention of paper money in 806 AD to the birth of Paypal, we count down every major disruption in payments in one giant...
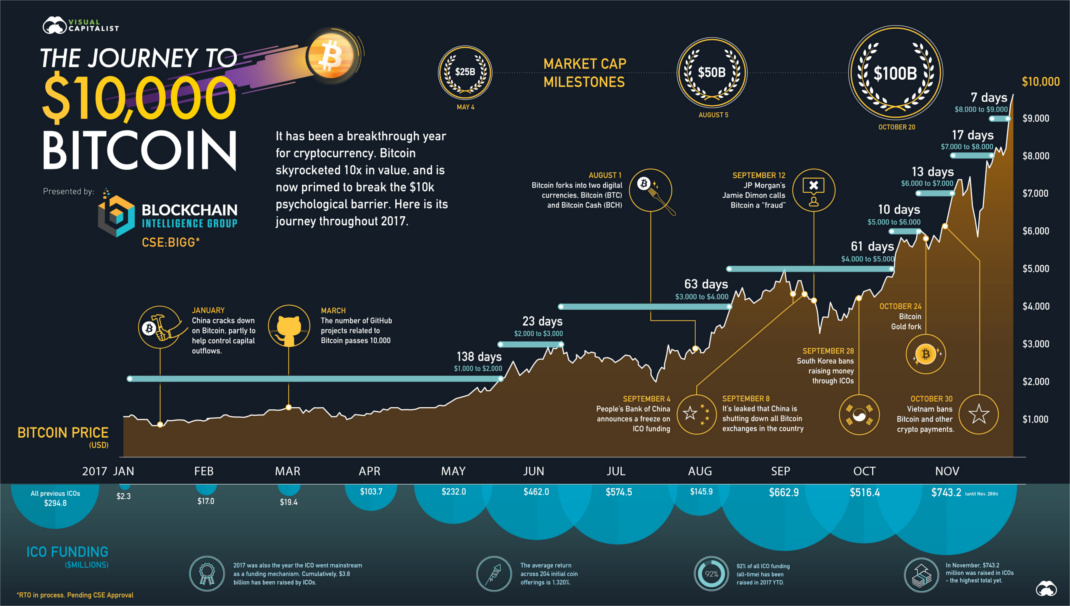
How did Bitcoin jump 10X in value in the matter of just 11 months? This timeline visualizes the events in the journey to $10,000 Bitcoin.
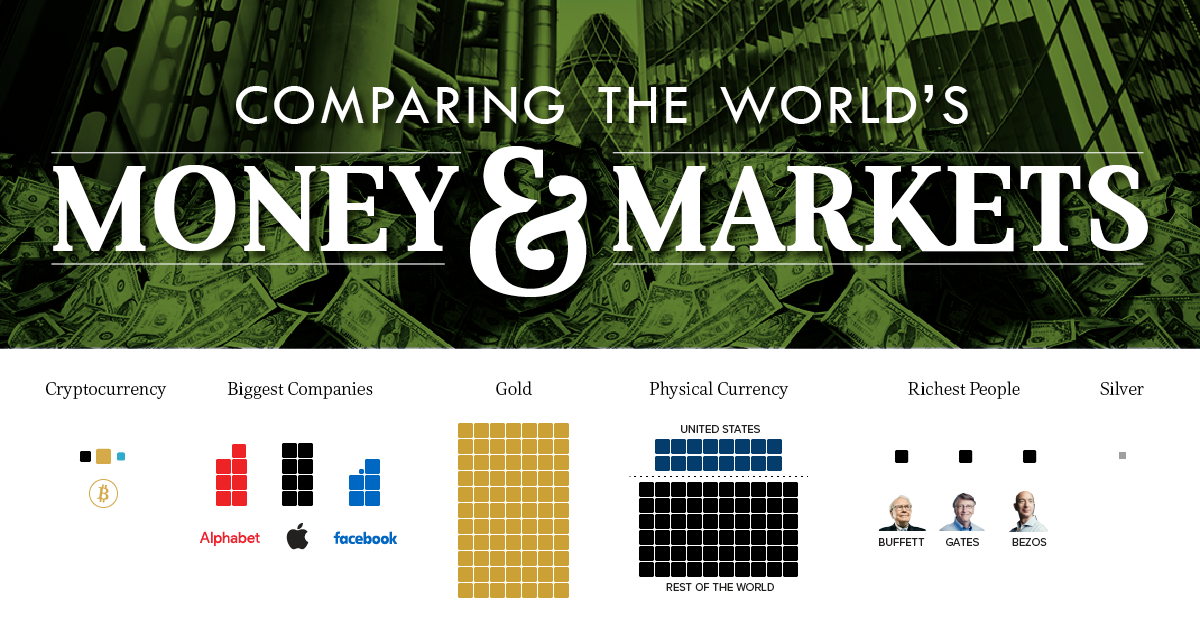
How much money exists in the world? This updated visualization compares the world's richest people, companies, and markets with the world's money supply.

The applications of blockchain tech go way beyond just payments. See how smart contracts work in this infographic, and how they may shape entire industries.
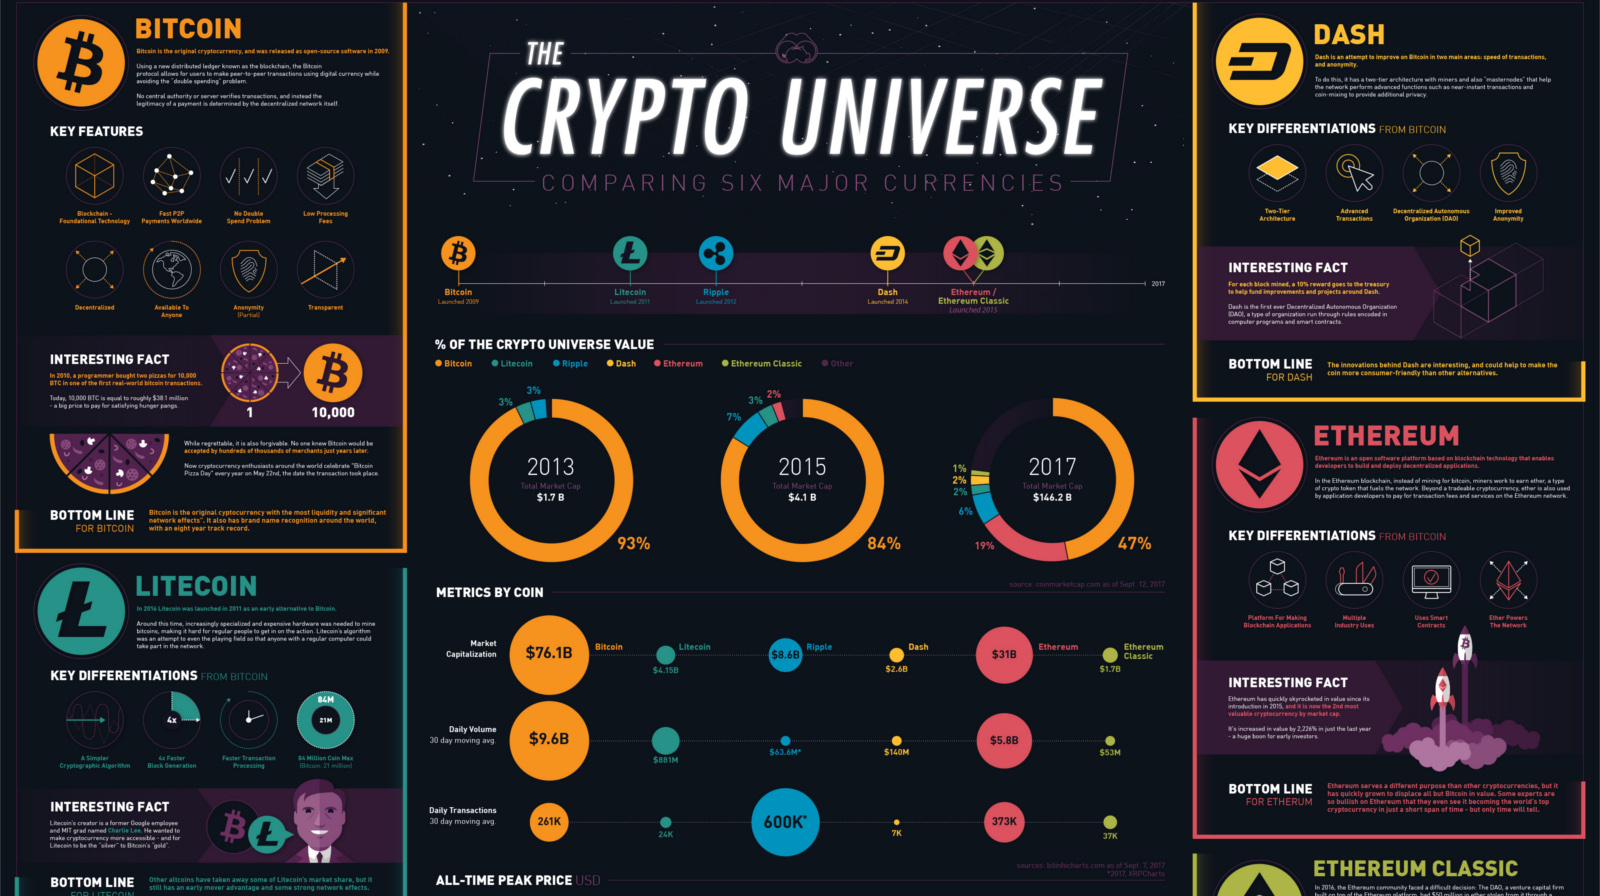
What's the difference between Bitcoin, Ethereum, Dash, Ripple, and Litecoin? This infographic breaks it all down, as well as many other key metrics.
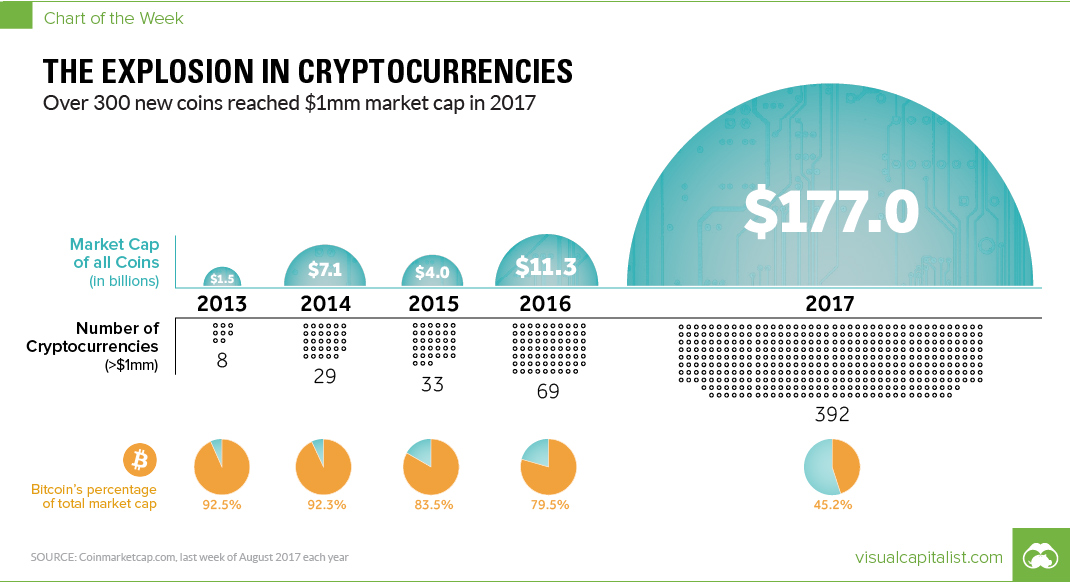
In 12 months, the number of cryptocurrencies worth >$1mm has soared by 468%. Meanwhile, the total value of all currencies together has skyrocketed by 1,466%.
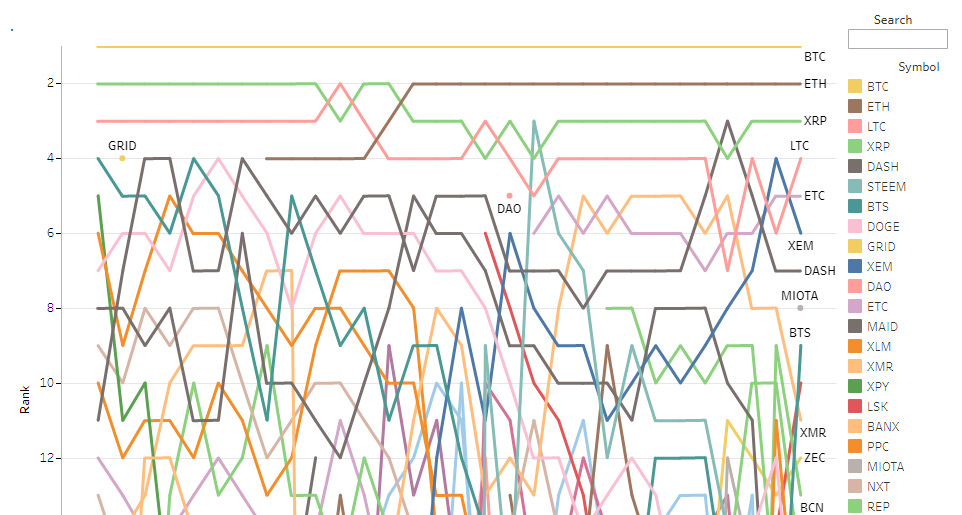
The coin universe is fast-moving and sometimes chaotic. See how the list of the top 20 cryptocurrencies has changed over the last 2.5 years.

This infographic cuts through the mystique of the Dark Web and provides an entertaining and practical overview of this mysterious portion of the internet.

Algorithms do the digital heavy lifting that keeps our society running smoothly. This infographic shows how they work, and how they affect us daily.


