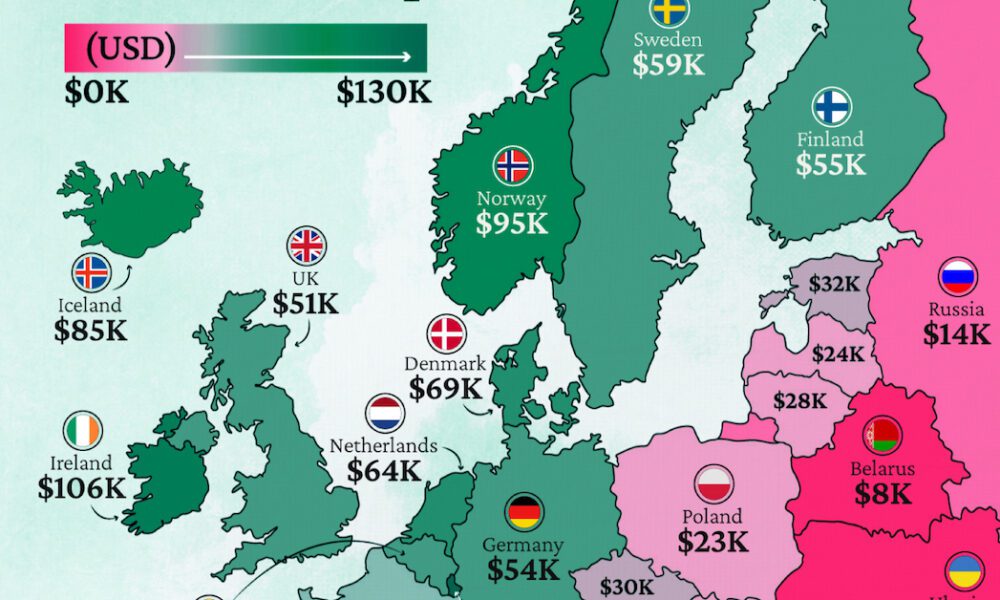
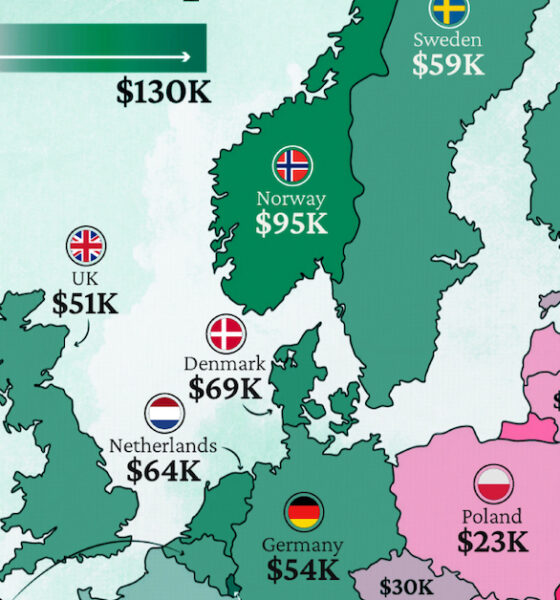
Which European economies are richest on a GDP per capita basis? This map shows the results for 44 countries across...
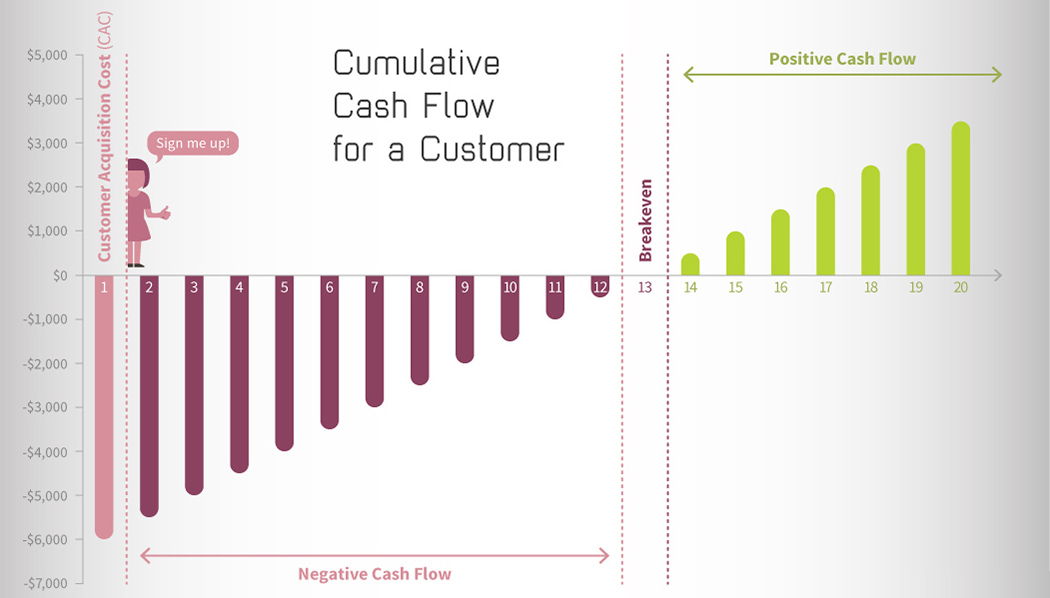
Recurring, predictable revenue is one reason why elite tech investors love making investments in SaaS companies. See the others in this infographic.
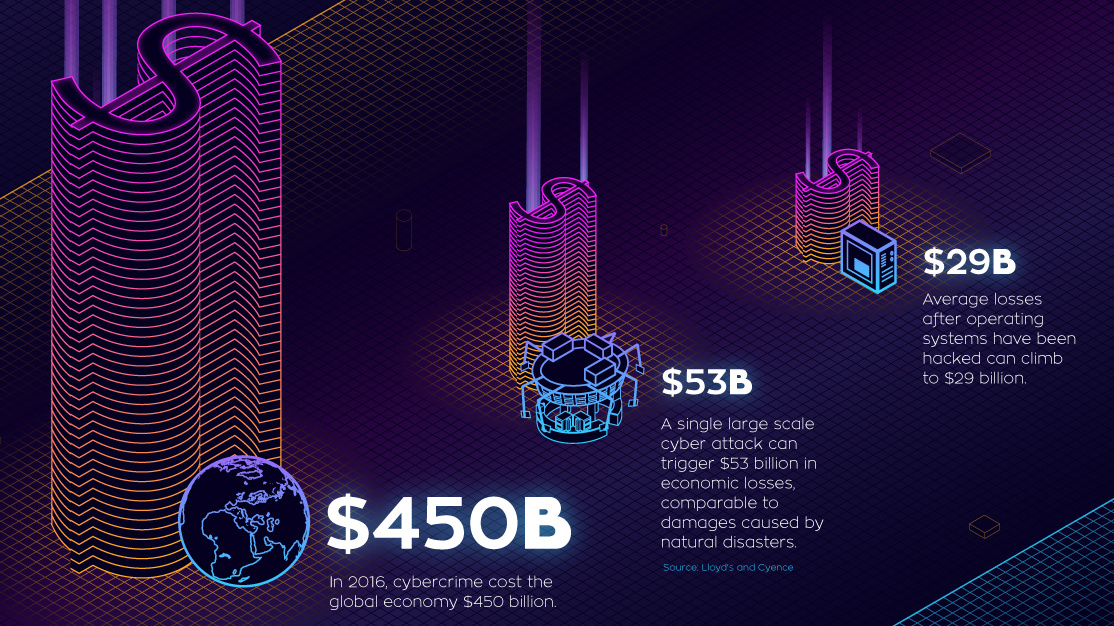
Cybercrime is rising, and companies like Uber, Equifax, and HBO are getting hit hard. See the resulting boom in cybersecurity spending in this infographic.
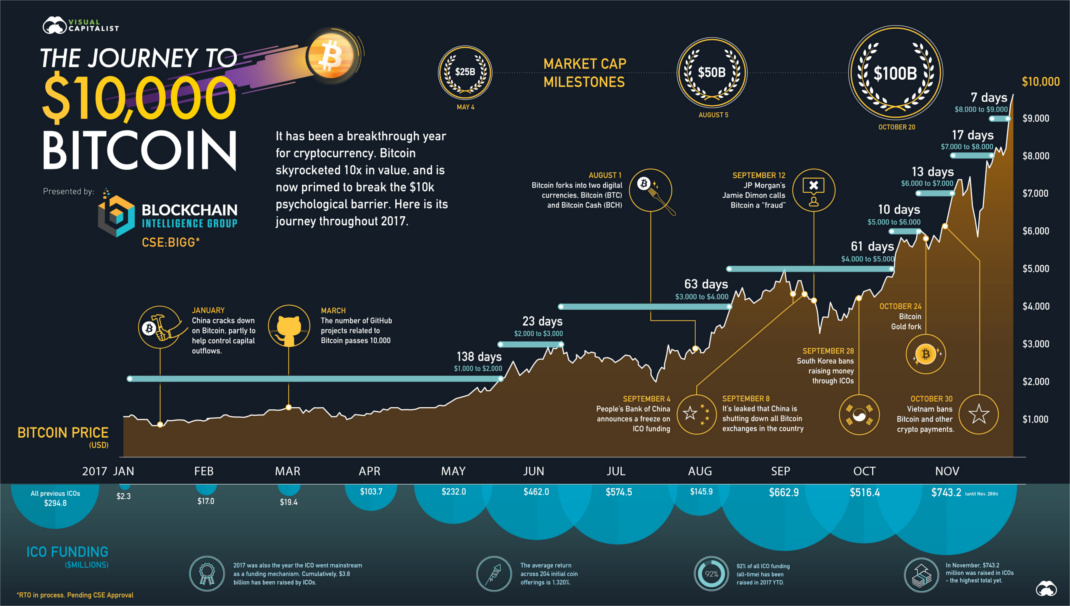
How did Bitcoin jump 10X in value in the matter of just 11 months? This timeline visualizes the events in the journey to $10,000 Bitcoin.
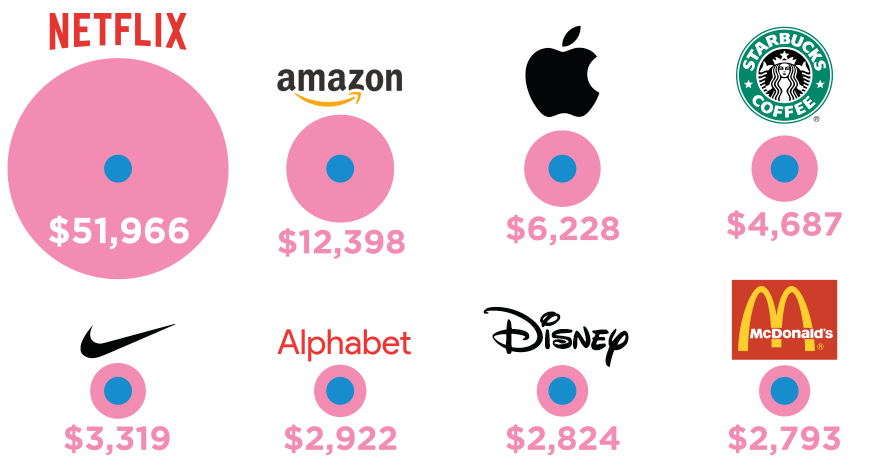
What would happen if you had invested $1,000 in Apple, Starbucks, Walmart, Coca-Cola, or other household names right before the market crash?
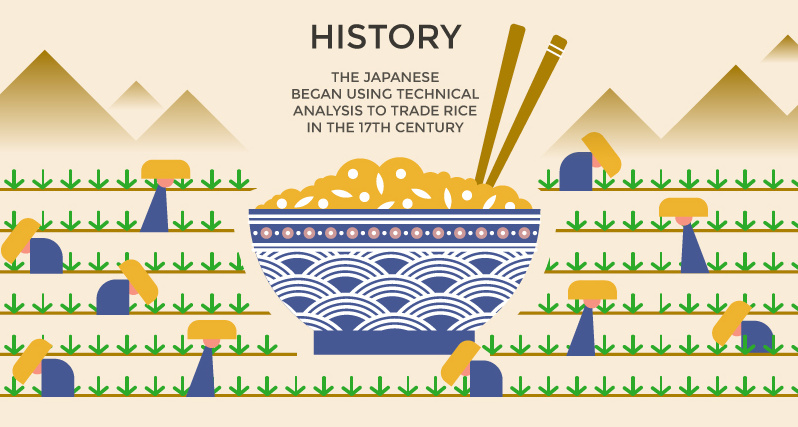
Originally used by 17th century rice traders in Japan, today candlestick charts are used by investors and traders to gauge the momentum of securities.
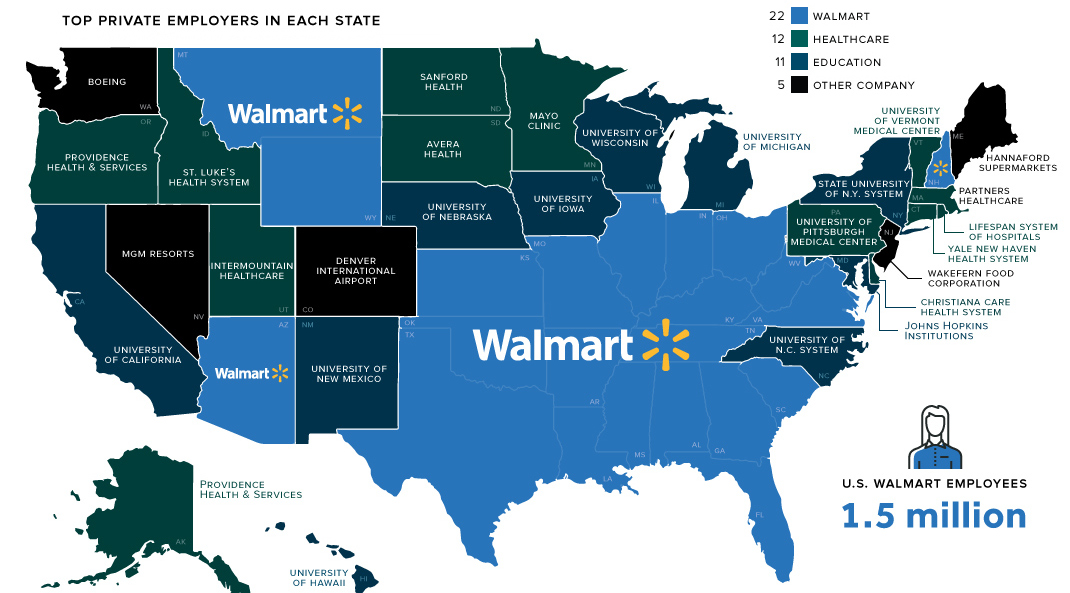
Walmart employs 1.5 million people across the country - and the retail behemoth is now the largest private employer in 22 states.
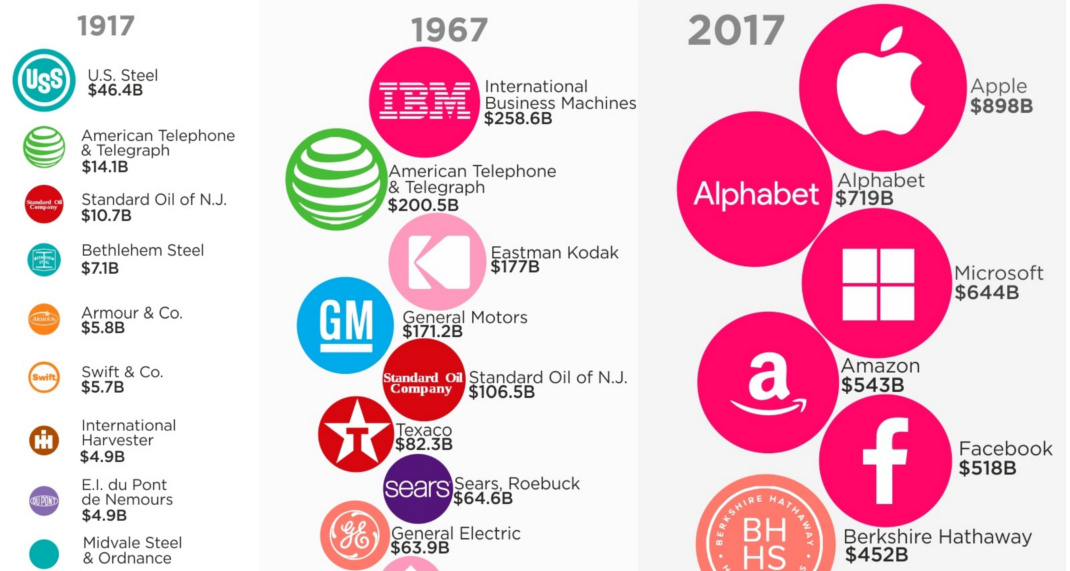
How have the most valuable companies in the U.S. changed over the last century? Today's graphic shows the evolution from U.S. Steel to Apple.
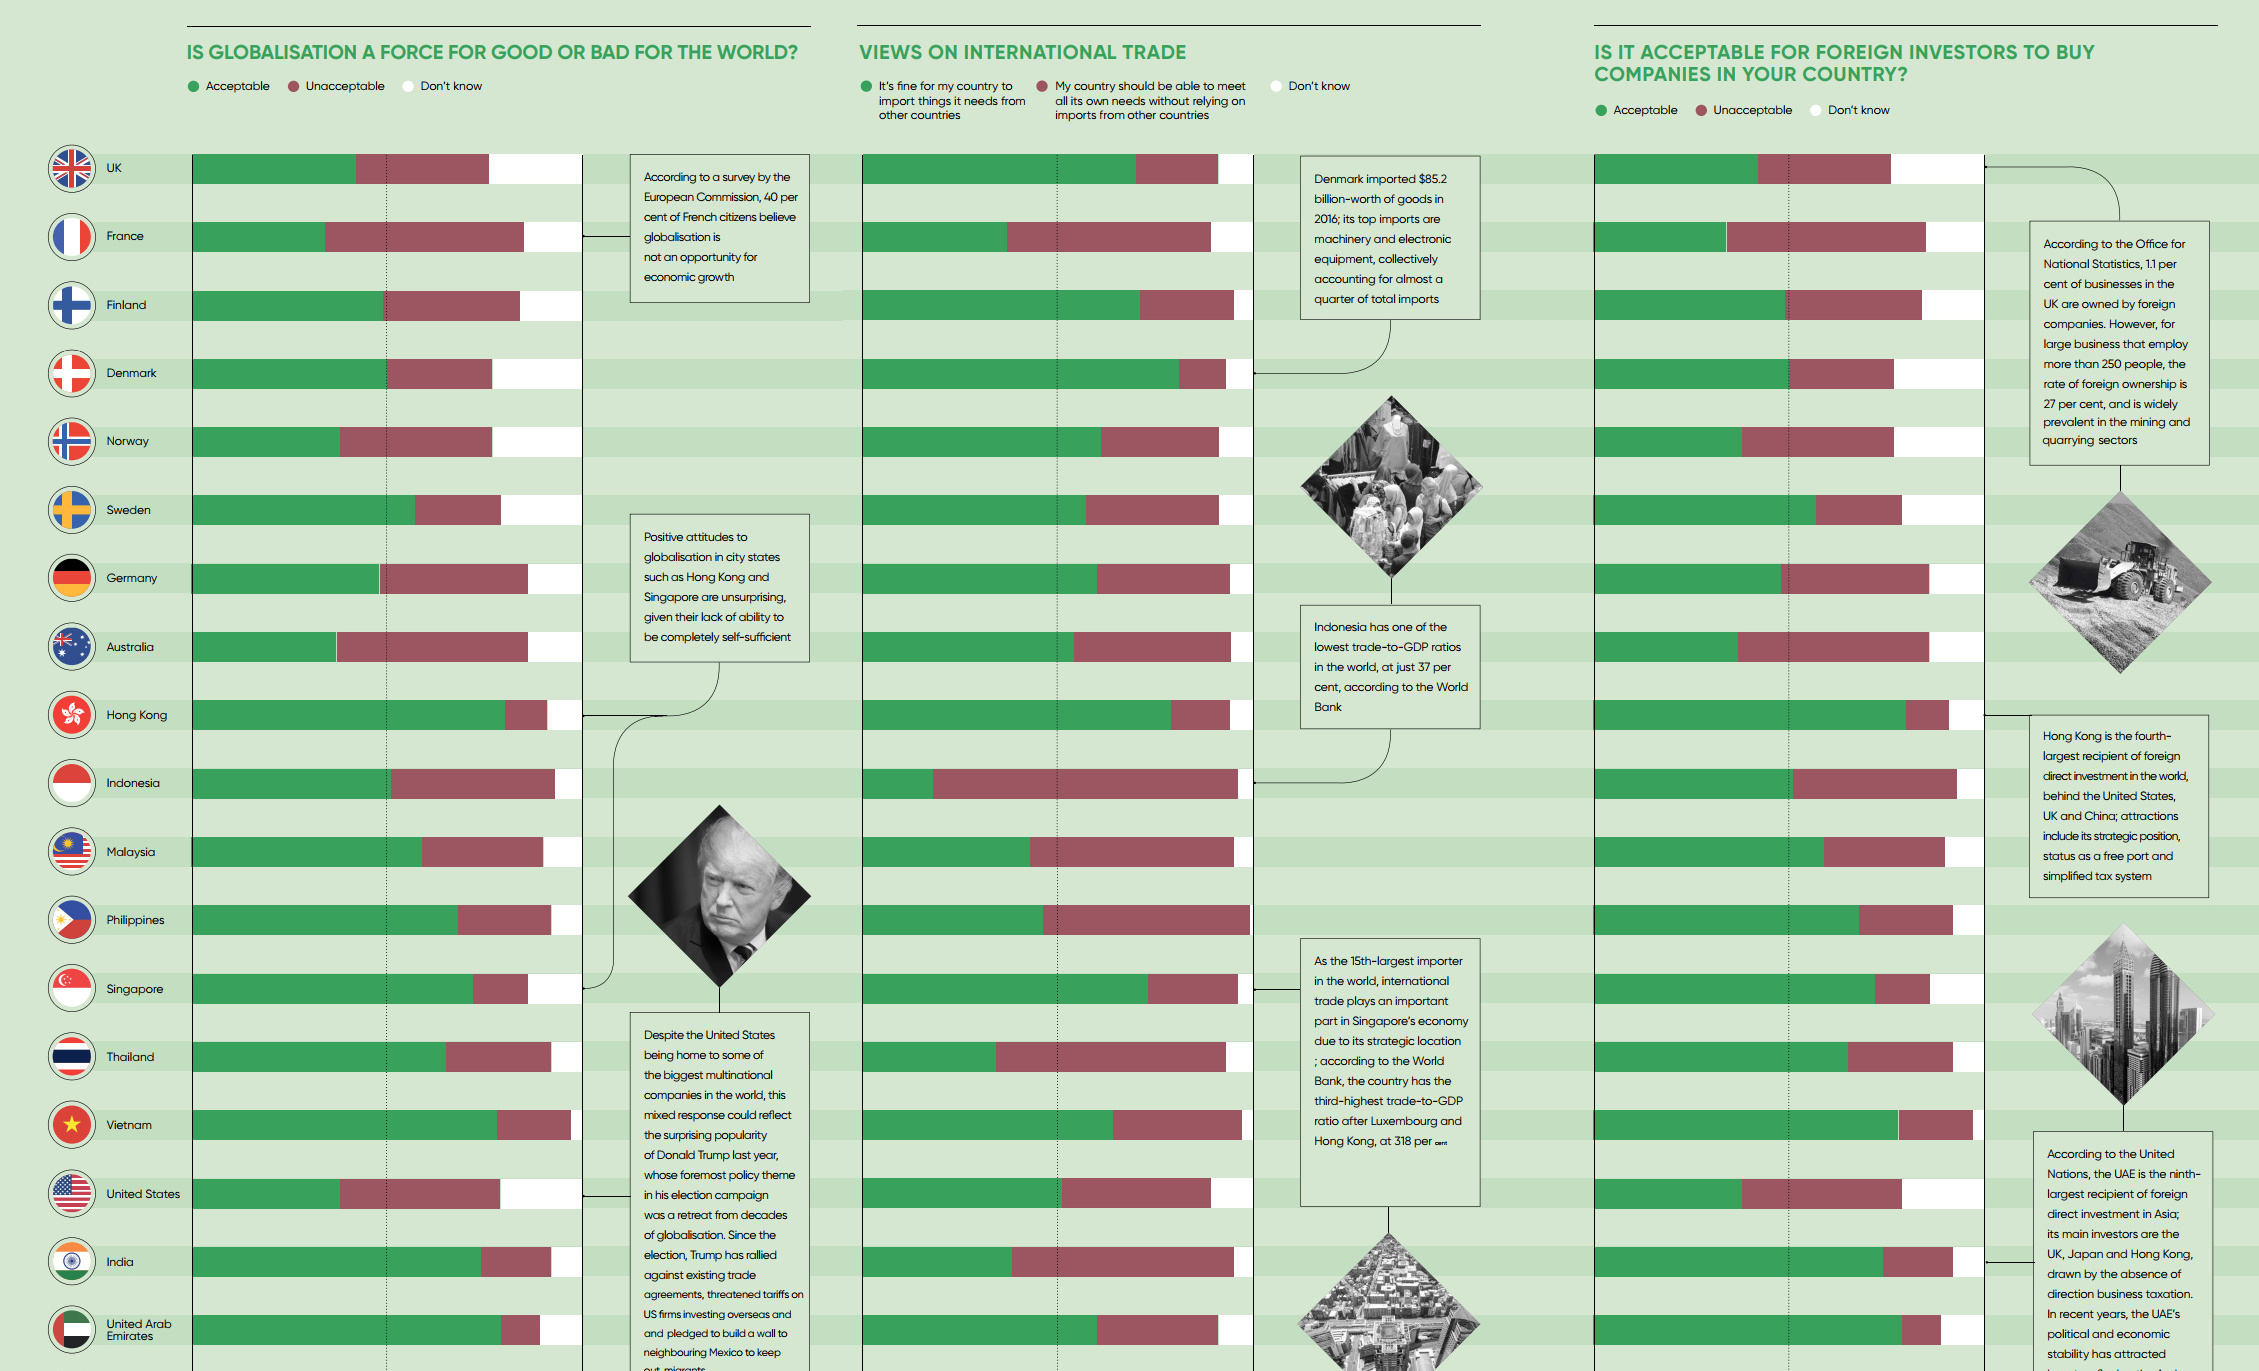
Is globalization a force for good or bad? The answer to this question depends greatly on who you ask - here is a survey of people...
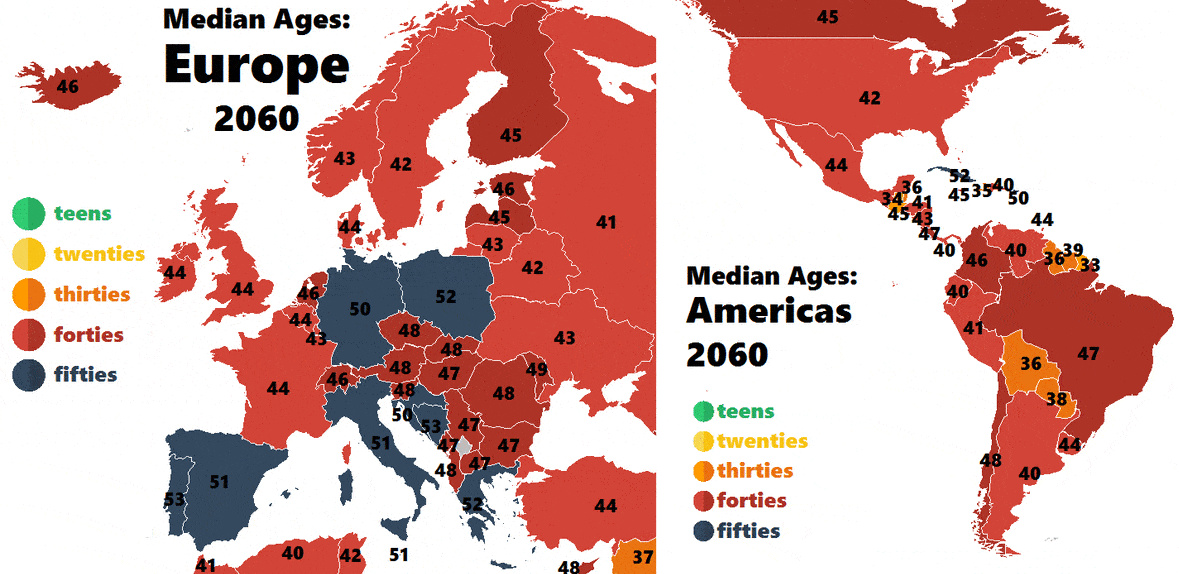
How fast are countries in Europe and the Americas aging? These colorful animations show how the median age is projected to change up until the year...
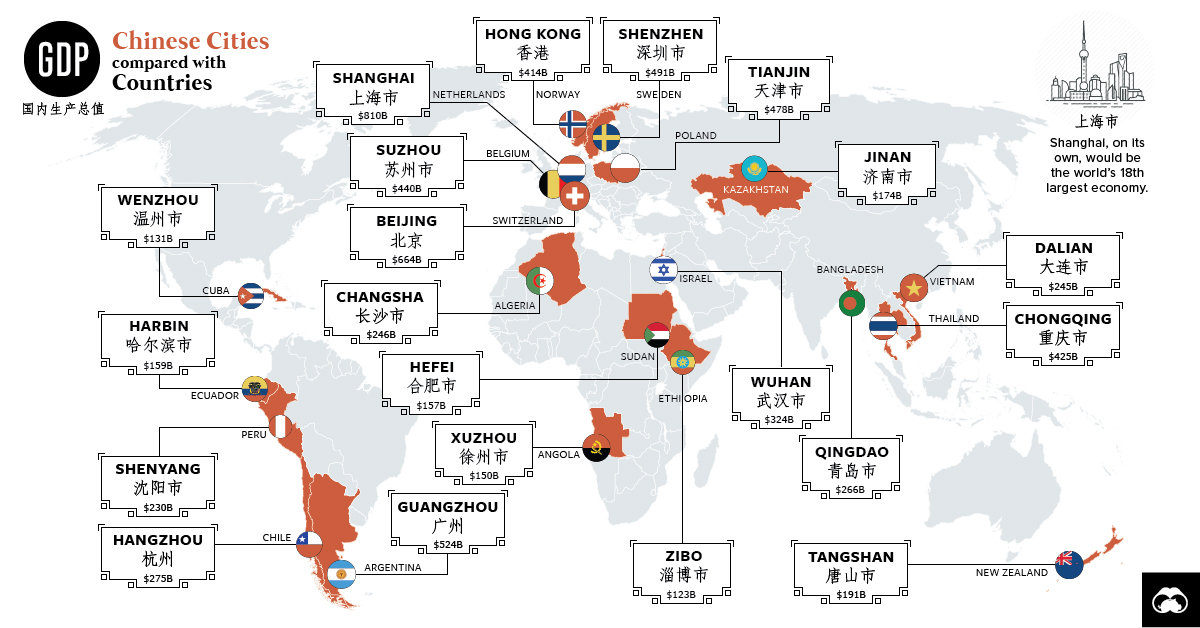
You've probably heard of Chinese cities like Beijing, Hong Kong, and Shanghai - but those actually only scratch the surface of China's economic picture.


